Over 90 per cent of the world’s population lived in areas with unhealthy air in 2015
E xposure to PM2.5 accounted for about 4.2 million deaths from heart disease and stroke, lung cancer, chronic lung disease and respiratory infections, according to the 2015 analysis of Global Burden of Diseases. Exposure to PM2.5 is the 5th highest risk factor for death after high blood pressure, smoking and cholesterol. Interestingly, over 50 per cent of deaths occurred in China and India.
✍ How to use graph: move mouse over particular country to know more (* all data for the year 2015)
✍ Data Source: State of Global Air 2017 and Institute for Health Metrics and Evaluation
➡ PM2.5: Population-weighted annual average, or mean, concentration (µg/m3).
➡ Ozone: seasonal average, population-weighted concentration (µg/m3).
➡ bur_mean: Average health burden (deaths or DALYs or their rates) due to PM2.5 (ug/m3) or ozone (µg/m3) exposure
➡ exp_mean - PM2.5: Population-weighted annual average, or mean, concentration (µg/m3). Ozone: seasonal average, population-weighted concentration (µg/m3)
On a global scale, the absolute number of deaths attributable to PM2.5 increased from 3.5 million in 1990 to 4.2 million in 2015, due both to increases in air pollution and to growth and aging in the global population
✍ How to use map: Select year and move mouse over particular country to know more
✍ Data Source: State of Global Air 2017 and Institute for Health Metrics and Evaluation
Note:
➡ PM2.5: Population-weighted annual average, or mean, concentration (µg/m3)
➡ exp_lower: Lower 95% uncertainty interval of exposure to PM2.5 or ozone.
➡ exp_mean: PM2.5: Population-weighted annual average, or mean, concentration (µg/m3).
➡ exp_upper: Upper 95% uncertainty interval of exposure to PM2.5 or ozone.
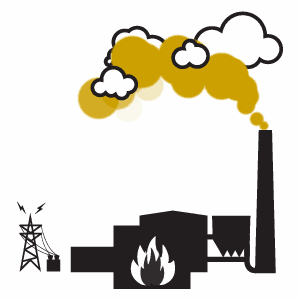
Highest PM2.5 concentrations appear in South Asia, Southeast Asia, eastern China, and Central and Western sub-Saharan Africa. Combustion emissions from coal-fired power plants, agricultural and other open burning are major sources of pollution.
Coal-burning by industry, power plants, and for home heating accounted for 40 per cent of PM2.5 exposures and an estimated 366,000 deaths in 2013. China and India together accounted for 52 per cent of the total global
deaths attributable to PM2.5
*Disability-adjusted life years (DALYs)
Years of healthy life lost to premature (early) death and disability (illness). DALYs are the sum of years of life lost (YLLs) and years lived with disability (YLDs). (DALYs are higher when young people die compared with when old people die, because young people still had many years ahead of them.).

India
India and Bangladesh experienced some of the largest increases in PM2.5-attributable mortality, on the order of 50 per cent to 60 per cent. India now approaches China in the number of deaths attributable to PM2.5
India, along with Bangladesh, has experienced the steepest increase in air pollution levels since 2010 and now have the highest PM2.5 concentrations among the countries studied.
Despite this, there was no concrete action hinted at the Union Budget 2016-17. With GST round the corner, will heads of these States adopt more effective and progressive approaches to make market work for environment and public health?
The analysis of the Central Pollution Control Board’s data since 2002 showed that all major cities in north and central India— Gwalior, Kanpur, Ludhiana, Gwalior and Surat—have recorded higher pollution rise in percentage terms between 2002 and 2014 as compared to Delhi.

Globally there was a 60 per cent increase in ozone-attributable deaths, with a striking 67 per cent of this increase occurring in India.
The State of Global Air 2017 report has estimated that India's ozone deaths rose at a rate of nearly 148 per cent over the past two decades - from 43,500 in 1990 to 107 thousand in 2015. China's ozone deaths have ranged between 65,000 and 75,000 over the corresponding period.
¤ Data Courtesy: State of Global Air 2017, Institute for Health Metrics, Evaluation and World Bank, World Health Organization and Central Pollution Control Borad (CPCB), India
¤ Text and Analysis: Lalit Maurya and Subhojit Goswami