HEALTH BURDEN
We are disappointed by the lack of ambition of the Modi government.
It intends to invest only 2.5 per cent of its GDP into health care by 2025,
when the global average for countries is about 6 per cent. What is even
worse is that high debt forces almost one in every four households in the
country to take loans or sell their assets to pay medical bills
A report by the Centre for Science and Environment (CSE) links air pollution to respiratory diseases. As much as 30 per cent of all premature deaths due to air pollution in India are from diseases related to the respiratory system and every third child in Delhi has impaired lungs. India has failed to achieve healthcare goals, badly lagging behind China, Sri Lanka and Bangladesh in terms of accessibility and quality, as per the new Global Burden of Disease study published in the medical journal The Lancet. India was ranked 154th in the ranking of healthcare quality amongst 195 countries. Why did India fail to achieve quality Healthcare?
Data Source:
✿ National Health Profile, 2017
✿ Institute of Health Metrics and Evaluation (IHME), 2016
✿ Lancet
✿ World Bank
✿ Worth Health Organisation
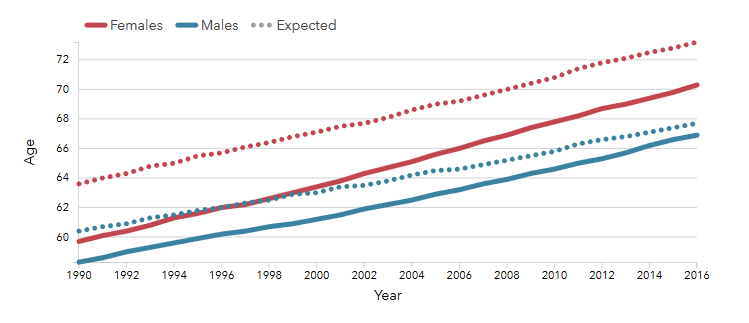
What is the life span of people living in India?
68.3Years

The latest WHO data published in 2015 revealed that in India, life expectancy is 68.3 — male 66.9, female 69.9. It gives India a World Life Expectancy ranking of 126.
Data Source:
✿ Institute of Health Metrics and Evaluation (IHME)
In 55 years, India’s life expectancy at birth–the average number of years a person is expected to survive if existing patterns of mortality stayed the same throughout their life-an indicator of the strength of the health system throughout the lifecycle of a citizen, rose by 65.8 percent or 27 years.

 Did you know? Jharkhand (66.6 years), Odisha (65.8 years), Chhattisgarh (64.8 years) and Uttar Pradesh (64.1 years) and Assam (63.9 years) are among the states with lowest life expectancy
What is the mortality trend in the under-5 and under-1 age groups?
840,000
children in India die before completing the first year of their lives
Data Source:
✿ Don't Pollute My Future: The impact of environment on children health, WHO, 2017
Every year, more than 840,000 children in India die before completing the first year of their lives. The number is more than that of any other country in the world.
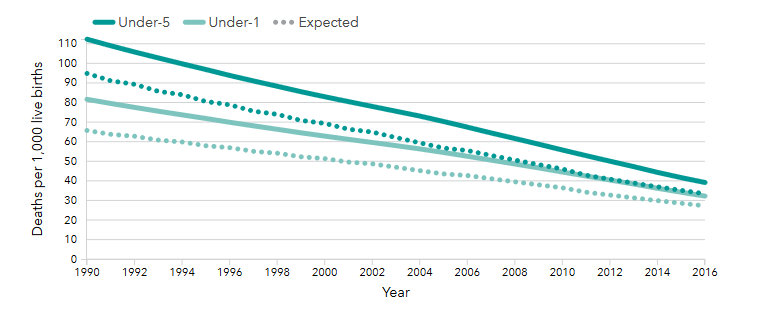
In 55 years, India’s infant mortality rate (IMR),an indicator of the strength of the health system, declined from 37 per 1000 live births in 2015 to 34 per 1000 live births in 2016, showed the latest government data released in September 2017. However, there is still a long way to go to meet the 2019 target of IMR 28 per 1000 live births.
Data Source:
✿ Sample Registration Survey (SRS) Bulletin, 2017
The number of children per 100,000 people, who die due to all environmental risks in India, is 248.14, which is the highest among BRICS countries. This is almost three times higher than China. Even air pollution-related deaths are the highest in India among its peers. Close to 48 children below the age of five, die per 1000 live births in India due to air pollution as compared to 10.7 in China.
Did you know? Assam (44 per 1,000), Chhattisgarh (39 per 1,000) Madhya Pradesh (47 per 1,000 ), Odisha (65.8 years) still have the highest infant mortality rates across the country
What causes the most premature deaths?
2.5Million
premature deaths in India caused by pollution alone
A report by the Centre for Science and Environment (CSE) says that in Delhi, which is among the world's most polluted cities, every third child has impaired lungs. The 2016 Global Burden of Disease shows that 9,20,000 premature deaths occurred in India due to household air pollution and 5,90,000 premature deaths due to ambient air pollution.
Data Source:
✿ Body Burden: State of India's Health, 2017
✿ Global Burden of Diseases, 2017
✿ IHME
✿ Lancet
In 2013, high blood pressure, high blood sugar, household air pollution from solid fuels, unsafe water sources and smoking were the top avoidable risks associated with health loss and a significant amount of disease burden among Indians among both sexes. 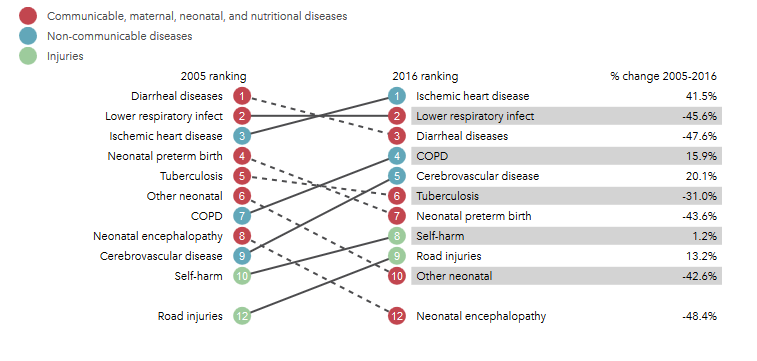
Of the five top risks, high blood pressure, diabetes and household air pollution from solid fuels were estimated to cause 7.8 per cent, 5.2 per cent and 4.7 per cent of the total health loss in India in 2013 respectively.
Did you know? Air pollution is the fifth largest killer in India and it claims about 1.5 million lives every year. In the national capital alone, poor quality of air is known to have affected 2.2 million people-a large chunk of it being children
What causes maximum deaths?
61per cent
Over 61 per cent of total deaths in India were attributed to lifestyle or non-communicable diseases (NCDs).

India had an estimated 22.2 million chronic COPD patients and around 35 million chronic asthma patients in 2016. In India, 26 per cent of all deaths occur due to cardiovascular diseases. More than 1.73 million new cancer cases are likely to be recorded each year by 2020 in India. Commonly used household chemicals and cosmetics contain cancer-causing compounds. More than 10 per cent of the country’s population over the age of 18 suffers from various kinds of mental illnesses. 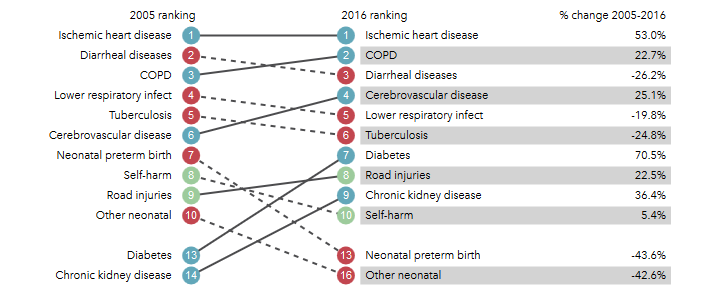
Data Source:
✿ Institute of Health Metrics and Evaluation (IHME)
The CSE report, "Body Burden: Lifestyle Diseases", estimated that India had 22.2 million chronic COPD patients and around 35 million chronic asthma patients in 2016. It identified, among the fallouts of environmental pollution, mental health diseases. According to the report more than 1.73 million new cancer cases likely to be recorded each year by 2020, and air pollution, tobacco, alcohol and diet change are primary triggers.
Did you know? About 33 per cent of the Indian population above 30 years is suffering from one or more lifestyle diseases such as diabetes, cardiac problems, blood pressure, thyroid and cancer
What health problems contribute to disability?
2.68crore
persons are disabled which is 2.21 per cent of the total population

Over five crore Indians suffered from depression, a major contributor to global suicides. This occurred mainly in low-and middle-income countries like India in 2015, revealed a WHO study. 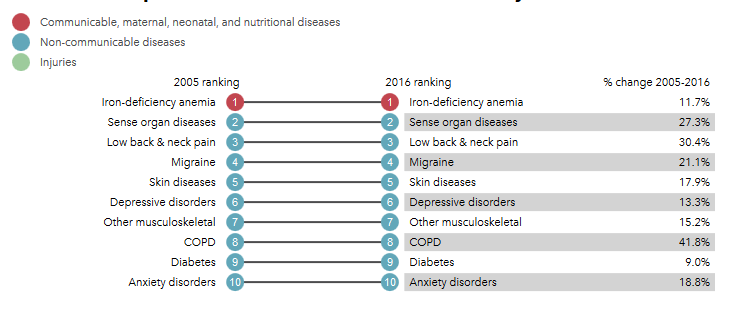
Data Source:
✿ Institute of Health Metrics and Evaluation (IHME)
According to the United Nations, around one billion people live with disabilities globally. Among them, 40 to 80 million live in India. Half the people with disabilities cannot afford health care.
Did you know? India is home to 194.6 million undernourished people. That's three times the entire population of France. The country is home to over one-third of the world's stunted (chronically malnourished) children.
What causes the most death and disability combined?
6.0
million people died in India due to NCDs in 2016
The Global Burden of Disease (GBD), 2016 data reveals that non-communicable diseases (NCDs) and injuries continue to be the main cause of death among people of all age-groups in India.
GBD data, published recently in The Lancet, showed that seven of the top 10 causes of death among all age-groups in India are due to NCDs or injuries. More than 6 million people died in India due to NCDs in 2016, with ischemic heart disease being the leading cause of death.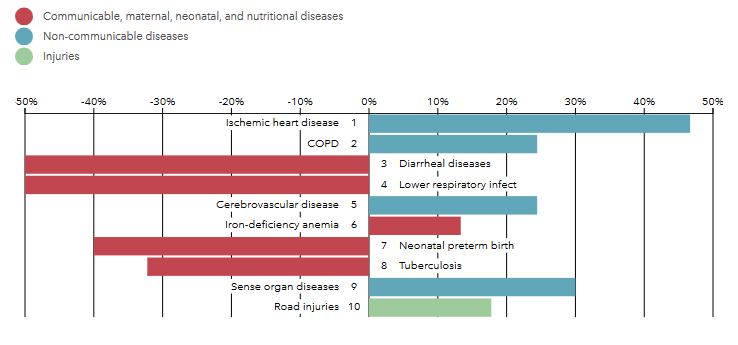
Data Source:
✿ Institute of Health Metrics and Evaluation (IHME)
The World Health Organization (WHO) has estimated that, with the current burden of CVD, India would lose $237 billion due to the loss of productivity and spending on health care over a 10-year period (2005–2015).
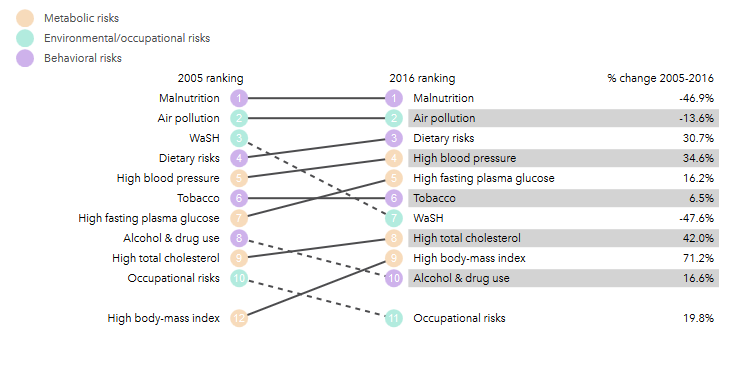
Risk Factors
Malnutrition and air pollution continue to be the top risk factors causing death and disability in India in 2016, according to the Global Burden of Disease report released on September 15, 2017.
Data Source:
✿ Institute of Health Metrics and Evaluation (IHME)
Maternal and child malnutrition caused 68 million DALYs in India in 2016–the highest in the world. Despite a 47% reduction in DALYs caused from it between 2005 and 2016.
Air pollution alone caused 45 million DALYs in 2016-13 per cent lower than in 2005. Dietary risks-eating the wrong diet low in grains, fruits, nuts, seeds and fish oils and high in salt-replaced unsafe water and sanitation and hygiene to be India’s third deadliest risk factor, causing 41 million DALYs in 2016.
Did you know? In India, 2.68 crore people are disabled, which is 2.21 per cent of the total population. Among the disabled population, 56 per cent (1.5 crore) are males and 44 per cent (1.18 crore) are females.
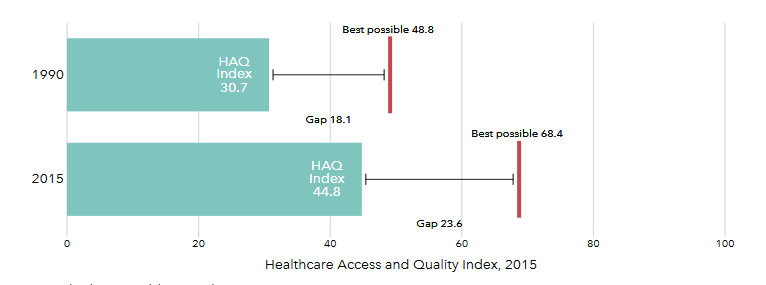
How do personal healthcare access and quality measure up against what is considered "best possible"?
178
India ranks last amongst all the BRICS nations in quality and access to healthcare, and 178th out of 195 countries worldwide.

According to the Global Burden of Disease Study published in the Lancet, India continues to be a poor performer in terms of access to healthcare. It ranks below countries like China, Sri Lanka, and even Bangladesh, illustrating India's failure in achieving healthcare goals.
Data Source:
✿ Healthcare Access and Quality Index, 2015
This gap has broadened in the last 25 years, in spite of flourishing economic development. However, the country’s score has increased by 14.1 points in the healthcare index, from 30.7 in 1990 to 44.8 in 2015.
The Indian healthcare industry’s growth has been rapid, with a compound annual growth rate (CAGR) of 17 percent, and it is expected to be a $280 billion industry by the year 2020. Yet, the state of public healthcare services remains unchanged, with the accessibility to healthcare, doctors, and medical facilities being lower than it should be for a country as large and populated as India.
Did you know? In India, one government hospital bed serves 1,833 people on an average. The worst ratios are in Bihar (8,789) and Jharkhand (6,052). The country has one doctor for every 1,668 people. Maharashtra and Bihar have the worst doctor to patient ratios, with each doctor serving 27,790 and 28,391 patients respectively
How much is spent on health -- now, and in the future -- and from which sources?
US$328Billion
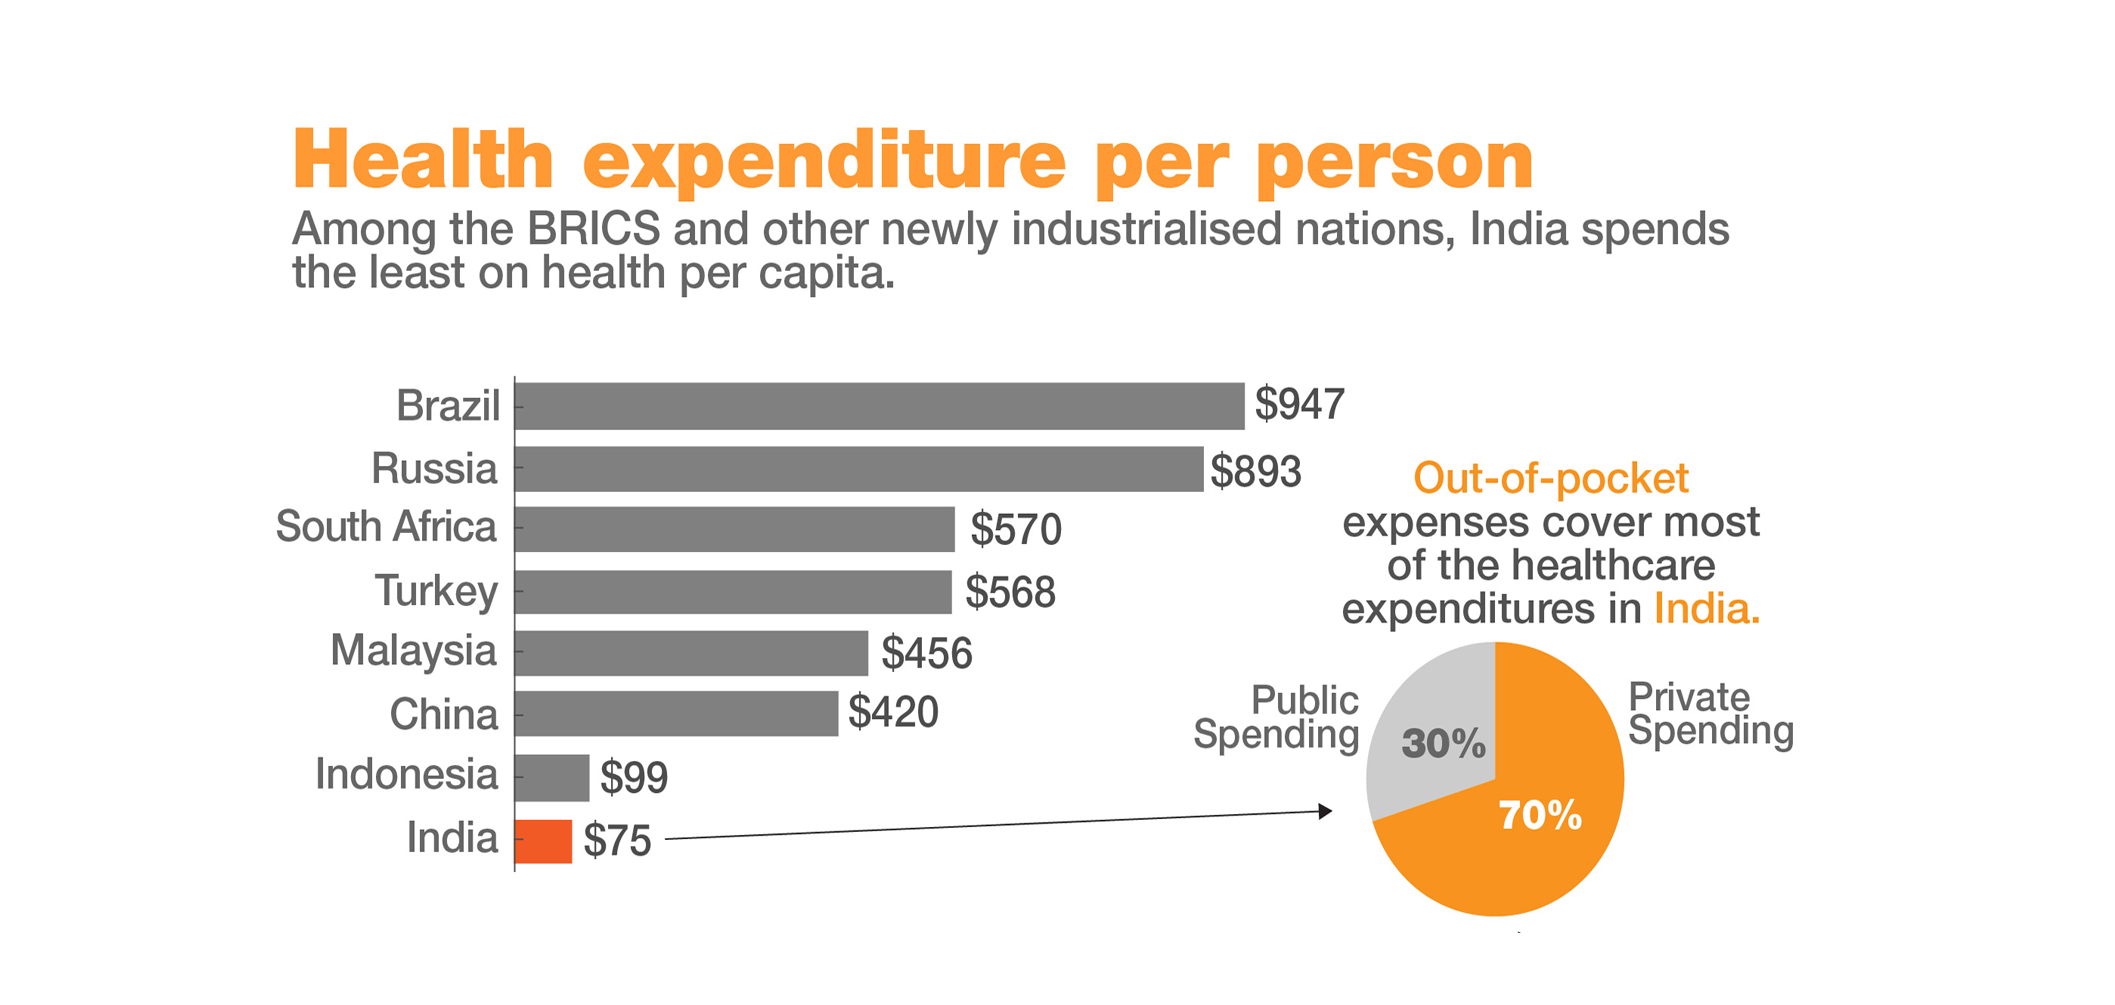
About five percent of the Indian government's annual expenditure goes towards healthcare. According to the World Health Organization (WHO), most of the healthcare expenditure in India - which averages $75 per capita - comes from the private spending of households.
A new research by The Lancet shows that India ranks 154 out of 195 countries in terms of access to healthcare, which is worse than Bangladesh, Nepal, Ghana, and Liberia. The country's public spending on health is "little over" 1 per cent of GDP, according to the Economic Survey.
India's spending on Health
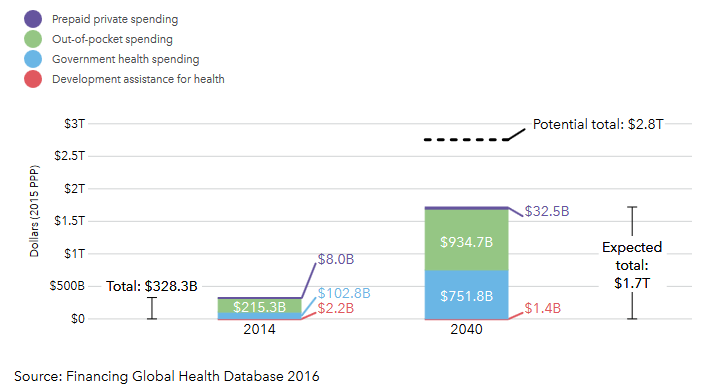
Data Source:
✿ Financing Global Health Database 2016
The average growth in expenditure on total healthcare is not only lower than the average annual GDP growth rate, but the expenditure is also still lower (as a percentage of GDP) than the expenditure of many developing and low-income countries.
Data Source:
✿ World Health Organisation (WHO)
Public vs. private healthcare
Private healthcare in India costs about four times more than the public sector, yet majority of all cases are treated by the private sector
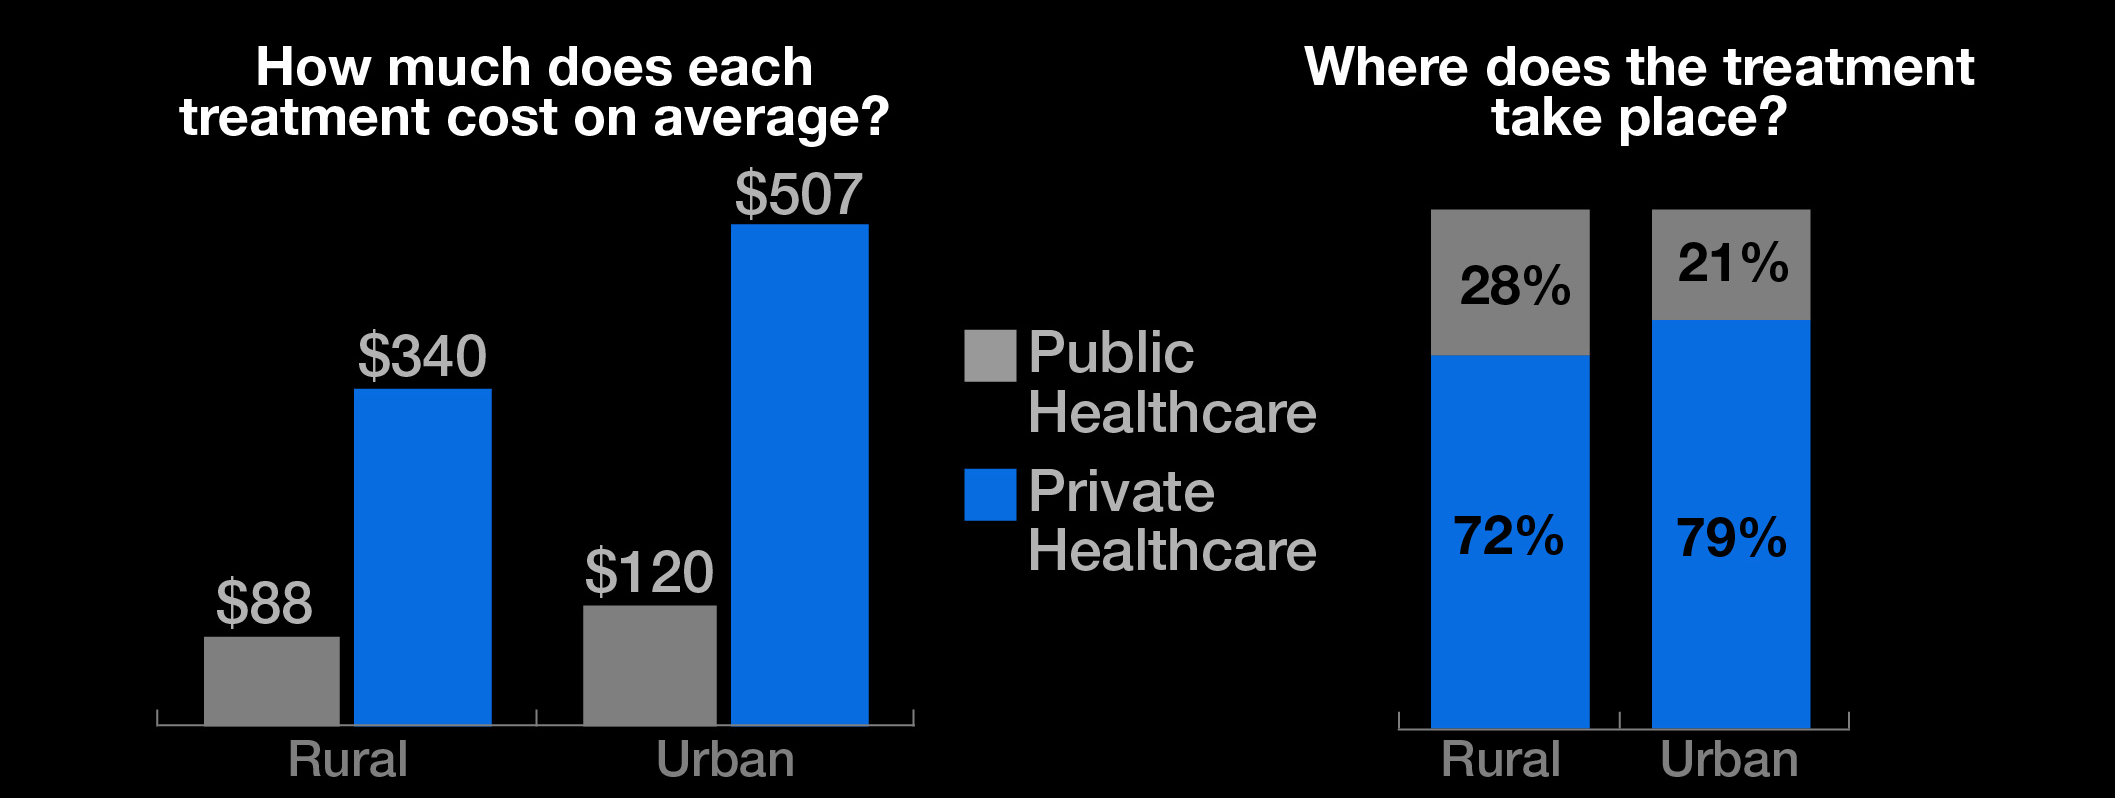
Data Source:
✿ NSS 2014, Ministry of Statistics and programme Implementation
Did you know? In India, 57.57 per cent of health expenditure is taken care of by individuals themselves. The out-of-pocket expenditure for health is the third highest after Bangladesh (63.35 per cent) and Pakistan (61.85 per cent)
On the healthcare front, things don't look too good for India right now
 The country’s healthcare system is characterised by inadequate infrastructure and limited resources. In fact, India’s healthcare infrastructure metrics is amongst the lowest in the world. According to the WHO World Health Statistics 2015, the public sector in India spent 1.16 per cent on health as a percentage of the GDP, ranking 187th among 194 countries.
Did you know? According to WHO statistics, in India, the proportion of lower income classes getting free health care in comparison to the proportion of higher income class with access to free healthcare is 17.33 and 22 respectively
The investment in healthcare is inadequate. Global evidence on health spending shows that unless a country spends at least 5-6 per cent of its GDP on health, basic healthcare needs are seldom met. Even in a small country like Mexico, the average spending on health per capita in 2013 was $1,045 as compared to a dismal $214 for India. We need to introspect and maybe even take cues from other countries that are successful along these lines.
Data Source:
✿ Institute of Health Metrics and Evaluation (IHME)
✿ Financing Global Health Database 2016
✿ Body Burden: State of India's Health, 2017, Centre for Science and Environment
✿ NSS 2014, Ministry of Statistics and programme Implementation
✿ World Health Organisation (WHO)
✿ Healthcare Access and Quality Index, 2015
✿ Global Burden of Diseases, 2017
✿ Lancet
✿ Sample Registration Survey (SRS) Bulletin, 2017
✿ Don't Pollute My Future: The impact of environment on children health, WHO, 2017
✿ GOQii 'India Fit' 2017 report
Presentation:
✿ Text and Analysis: Lalit Maurya and Subhojit Goswami
✿
Infographics: Lalit Maurya, Al Jazeera and IHME
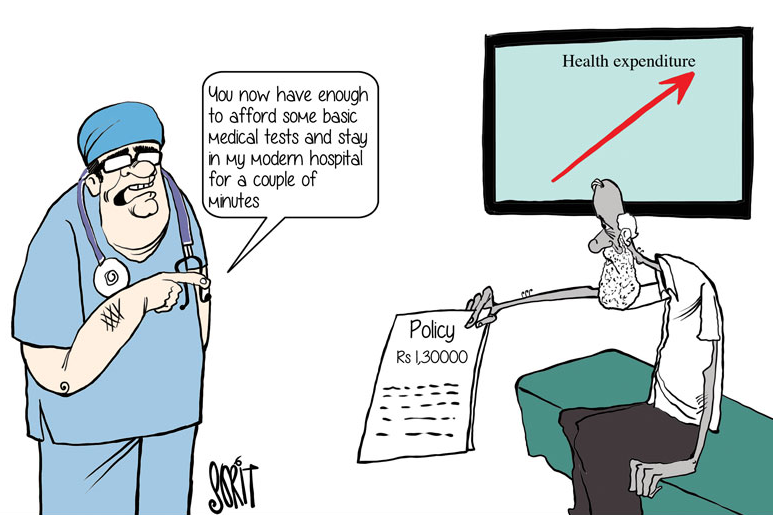
✿ Cover and illustrations: Sorit Gupto and Lalit Maurya