

The Narendra Modi government intends to invest only 2.5 per cent of the country's GDP into health care by 2025, while the global average is about 6 per cent. What is even worse is that high debt forces almost one in every four households in the country to borrow money or sell assets to pay medical bills
According to the latest National Health Profile (NHP) 2018, India is among the countries with the least public health spending. The Indian government plans to live up to its promise of 'health assurance to all Indians' with a health spending of just Rs 3 per person per day that counts for 1.02 per cent of the GDP.
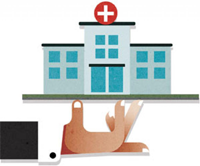 Did you know? India's per capita public expenditure on health increased from Rs 621 in 2009-10 to Rs 1,112 (around $16 at current exchange rate) in 2015-16. However, it is still nominal, compared with other countries. Switzerland spends $6,944 on health per capita, the United States spends $4,802 and UK $3,500.
India is one of the countries with the lowest public health spending. Even lower-income countries like Bhutan, Sri Lanka and Nepal spend 2.5 per cent, 1.6 per cent and 1.1 per cent of the GDP respectively on their people’s health.
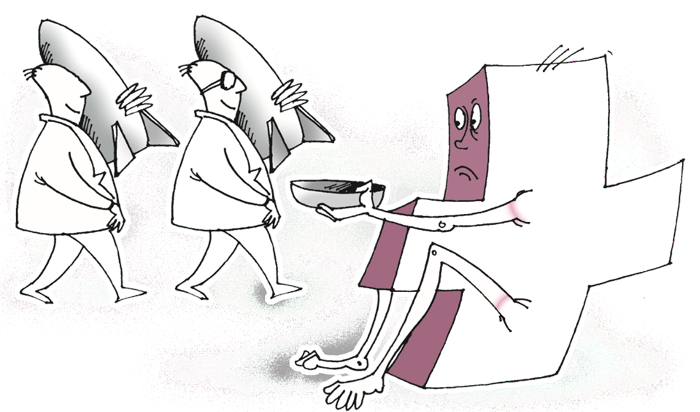
High Out-of-pocket expenditure
There is a need to enhance public health spending to a minimum of 5 per cent of the GDP. According to the National Health Accounts (NHA) estimate for 2014-15, the Government Health Expenditure (GHE) per person per year is only Rs 1,108 that comes to Rs 3 per day. This is in contrast to the Out-of-Pocket Expenditure (OPE) of Rs 2,394, which comes out to be 63 per cent of the total health expenditure.
 Did you know? WHO's health financing profile for 2017 shows 67.78% of total expenditure on health in India was paid out of pocket, while the world average is just 18.2%
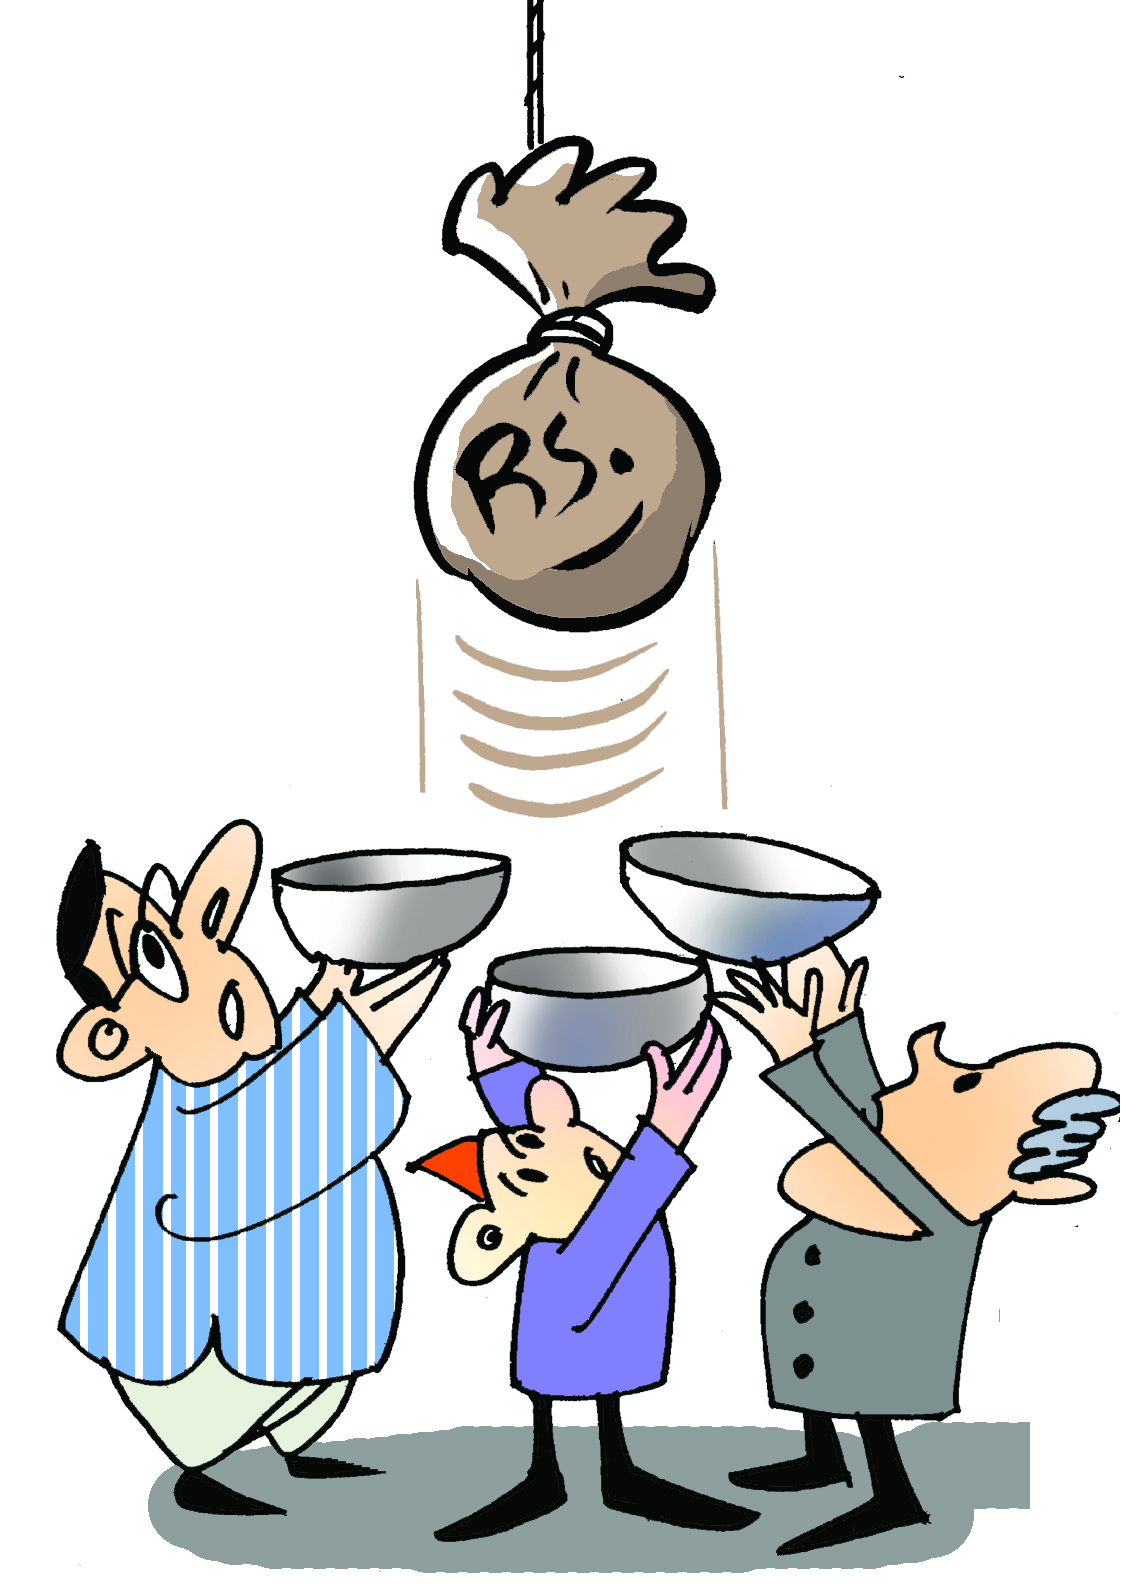
Bihar spent just Rs 491 per capita on health
Mizoram's per capita health expenditure is Rs 5,862, almost five times the Indian average, with the state spending 4.2 percent of its GDP on health in 2015. Arunachal Pradesh (Rs 5,177) and Sikkim (Rs 5,126) followed at the top.
At the other end of the spectrum, Bihar spent Rs 491 per capita on health -less than half the Indian average- spending 1.33 per cent of its GDP on health. Just above Bihar were Madhya Pradesh (Rs 716) and Uttar Pradesh (Rs 733). While Delhi spends Rs 1,992 per capita on health.
 Did you know? Mizoram’s per capita health expenditure is Rs 5,862, almost five times the Indian average, with the state spending 4.2 per cent of its GDP on health in 2015. Arunachal Pradesh (Rs 5,177) and Sikkim (Rs 5,126) followed at the top.
Where Indian households spend on health and need for a national free medicines scheme
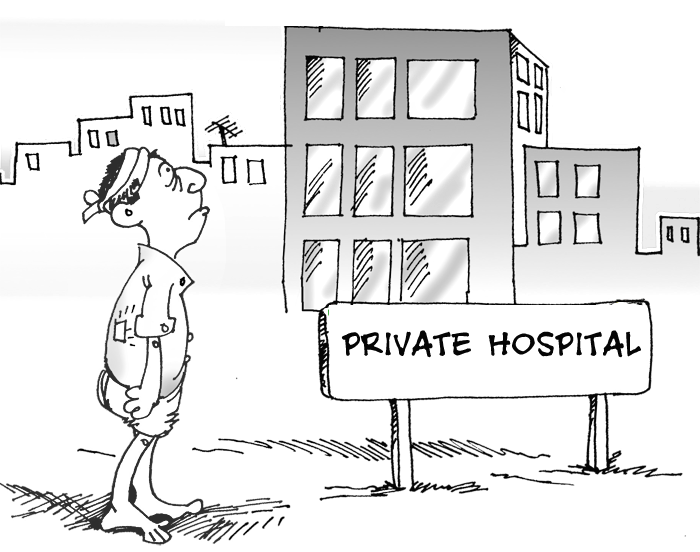
The Union health ministry reveals that medicines are the biggest financial burden on Indian households. Of more than three lakh crore rupees that households spent on health in 2014-15, around 43 per cent of the total out-of-pocket spending (OOP) went in buying medicines. In private hospitals, households spent around 28 per cent of the OOP spending. Much of this problem of debt can be solved if medicines are made available to people at affordable prices. The National Health Policy 2017 also highlighted the need for providing free medicines in public health facilities by stepping up funding and improving drug procurement and supply chain mechanisms.
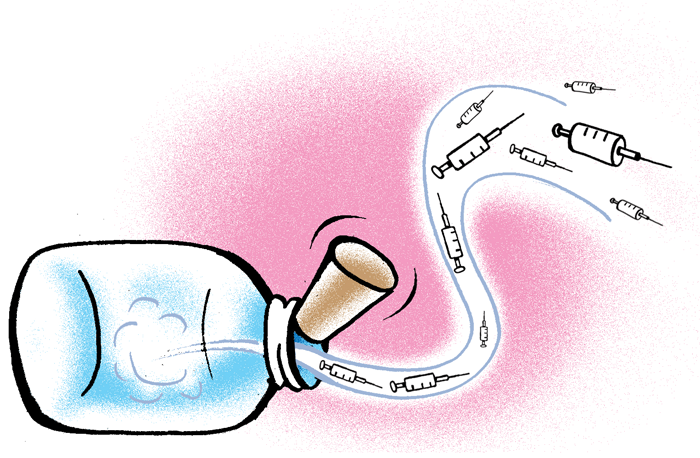
 Did you know? Households spent four times less in government hospitals (7.5%) than private hospitals.
Cost of inaction
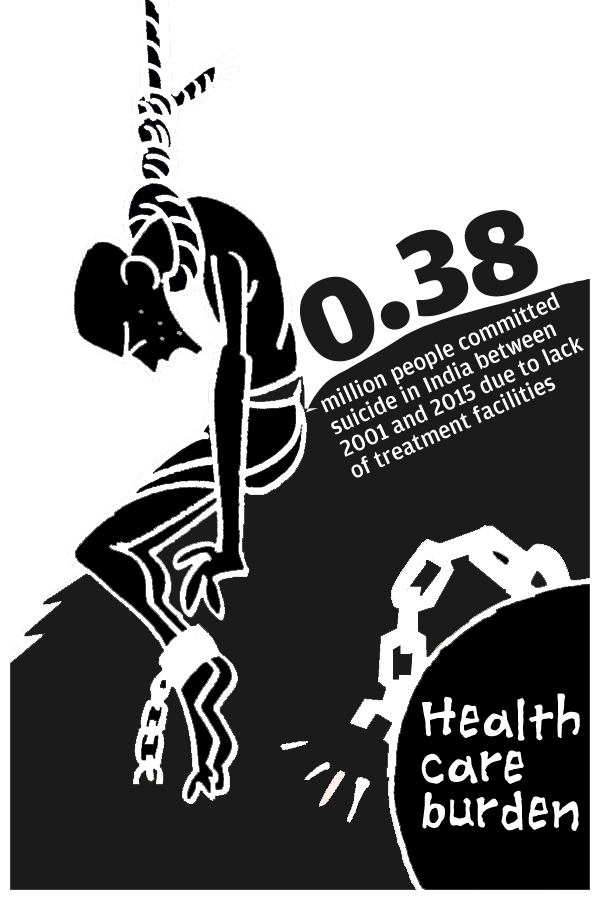 One of the central problems has been the low levels of public spending on health, and as a, result the poor access to affordable and good quality healthcare for the majority of India’s population. The National Crime Records Bureau says that 0.38 million people committed suicide in India between 2001 and 2015 due to the lack of treatment facilities. This is 21 per cent of the total suicides in that time. According to National Sample Survey Office (NSSO), outstanding loans for health reasons doubled between 2002 and 2012. In India, low health spending is pushing people towards the private sector for their healthcare needs since India stands sixth in the out-of-pocket (OOP) health spending among the low-middle income group of 50 nations.
 Did you know? 7% of Indians fall below the poverty line just because of indebtedness due to health expenditure. This figure hasn’t changed much in a decade. As a result about 23% of the sick can't afford healthcare.
The result of that, about 55 million Indians were pushed into poverty in a single year because of having to fund their own healthcare and 38 million of them fell below the poverty line due to spending on medicines alone, according to a new study.
Data source:
✸ National Health Accounts, Estimates for India (2014-15); October 2017, Ministry of Health and Family Welfare, Govt of India
✸ Impact of Publicly Financed Health Insurance Schemes on Healthcare Utilization and Financial Risk Protection in India: A Systematic Review, Plos One, Feb 2017
✸ Extending health insurance to the poor in India: An impact evaluation of Rashtriya Swasthya Bima Yojana on out of pocket spending for healthcare, May 2017
✸ NSS 71st round, Health in India, June 2014
✸ Govt’s shrinking footprint in India’s healthcare, Times of India, Dec 2018
✸ National Health Profile 2018
✸ Quantifying the financial burden of households’ out-of-pocket payments on medicines in India: a repeated cross-sectional analysis of National Sample Survey data, 1994–2014
✸ National Health Policy 2017
✸ Health financing profile 2017: India, World Health Organization (WHO)
✸ Health and Morbidity In India (2004-2014), Brookings Institution India, 2016