Delhi-based non-profit Centre for Science and Environment analyses the total, per capita and sectorwise greenhouse gas emissions of different countries based on latest available data
As per the latest data, China, with 19.2 per cent of the world’s population, was the world’s leading emitter of greenhouse gases (GHG) with an almost 24.5 per cent share in 2012. The United States, about 4.5 per cent of world’s population, was the second largest emitter of GHG with almost 13.9 per cent of the global share. India, with around 17.6 per cent of the global population, accounted for 6.7 per cent of the emissions.

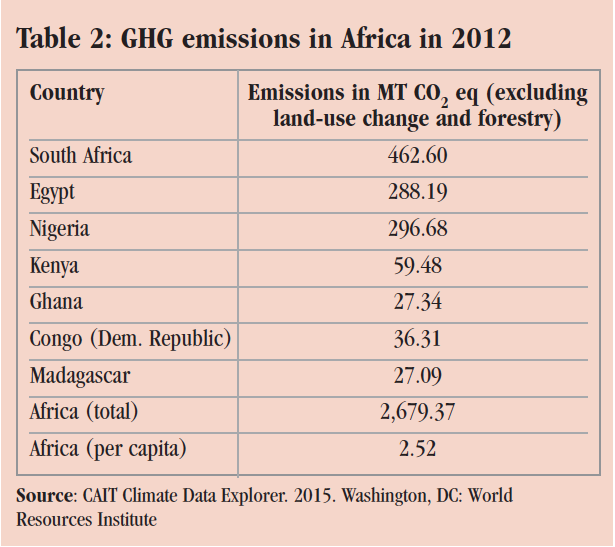
South Africa, Egypt and Nigeria were the top three emitters of greenhouse gas emissions in 2012.
Electricity and heat accounted for 32 per cent of global GHG emissions, making it the largest sector. Transportation accounted for 16 per cent and manufacturing and construction for 14 per cent of GHG emissions.

With regard to global share of emissions from electricity and heat, China, the US and EU-28 took the top spots, with around 30, 16 and 10 per cent respectively of the global total. India followed in the fifth position. The top six countries, including the EU-28, account for over 70 per cent of emissions from electricity and heat.

While China and India figure in the top five total emitters, the picture is completely different when per capita emissions are taken into account. The black line shows that India’s and China’s per capita emissions from heat and electricity are very low compared to that of developed countries like US, Japan, Australia and Canada. Qatar stands out in the list.

The transport sector is responsible for 16 per cent of global GHG emissions and is expected to grow to one-third by 2050. The graph below indicates that total and per capita emissions from the transport sector are highest in the US.

In India, the energy sector accounted for the most GHG emissions among all sectors. The graph below shows that the energy sector contributed 70 per cent of total GHG emissions while the agriculture sector accounted for 22 per cent.

The graph below shows the break-up of the energy emissions by its various sub-sectors. Total GHG emissions (excluding land-use change and forestry) from India in 2012 were 3,013.77 million tonnes of CO2 eq of which:
• CO2 emissions were 2,075.18 million tonnes
• CH4 emissions were 626.98 million tonnes
• N2 O emissions were 267.86 million tonnes
• Per capita CO2 emissions for 2012 were 1.68 tCO2
• Electricity and heat, at 52 per cent, accounted for highest GHG emissions by sector

Data analysis by Centre for Science and Environment, Delhi
We are a voice to you; you have been a support to us. Together we build journalism that is independent, credible and fearless. You can further help us by making a donation. This will mean a lot for our ability to bring you news, perspectives and analysis from the ground so that we can make change together.

.png)
Comments are moderated and will be published only after the site moderator’s approval. Please use a genuine email ID and provide your name. Selected comments may also be used in the ‘Letters’ section of the Down To Earth print edition.