PM2.5 levels dropped by 50% during the lockdown in the national capital, a new CPCB study said
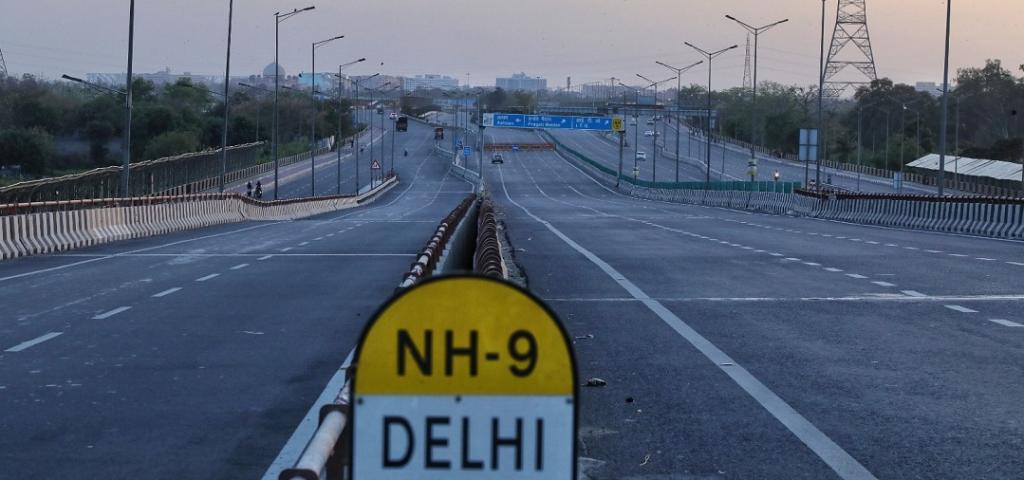
 Deserted Delhi roads during the COVID-19 lockdown. Photo: Vikas Chowdhury / CSE
 Social media was agog with photographs of clear blue skies in Delhi only days into the lockdown to curb the novel coronavirus disease (COVID-19) pandemic; the difference was underscored especially because of the Capital’s horrific experience post-Diwali 2019.
The cerrulean skies were attributed to a lack of industrial and vehicular activity during the lockdown when most economic activities were prohibited from March 25. Now, the Central Pollution Control Board (CPCB) has confirmed this in a recent report.
Particulate Matter (PM) 2.5 levels in Delhi halved during the COVID-19 lockdown from 2019 levels, according to Impact of Lockdown on Ambient Air Quality released by the CPCB September 23, 2020.
PM10 levels fell a massive 60 per cent while nitrogen dioxide (NO2) plummeted 64 per cent, benzene by 62 per cent and sulphur dioxide (SO2) 35 per cent, during the second phase of lockdown.
The CPCB had included satellite-based air quality assessment and the technique of real-time source apportionment studies carried out by the Indian Institute of Technology in Delhi and Kanpur for more effective ground-truthing, Anumita Roychowdhury, executive director of the Clean Air Programme at New Delhi-based non-profit Centre for Science and Environment, said.
“This combination of techniques must be taken forward to inform decision-making. These can be more effective in demonstrating real world change as a result of specific policy initiatives,” she added.
The study divided the assessment period into the pre-lockdown phase (March 1 – 21, 2020), the lockdown’s Phase-I (March 25 – April 19, 2020) and the lockdown Phase-II (April 20 – May 3, 2020).
PM 2.5 reduced by 38 per cent and 33 per cent reduction in comparison to pre-lockdown levels. PM10 reduced by 37 per cent and 30 per cent during the lockdown Phase-I and lockdown Phase-II periods respectively.
“PM2.5 and PM10 levels were seen to rise in the second week of the Phase-I of lockdown, that may primarily be attributed to change in meteorological conditions,” the report added.
This change in conditions included higher temperatures leading to dry and dusty conditions as well as a mild dust storm from the western part of the country hitting Delhi on April 14 and 15.
The impact of meteorological factors was slightly favourable in 2020, with average mixing height and wind speed showing improvement for pre-lockdown and lockdown phases, against the same time periods in 2019, the report said.
Wind speed and mixing height was also higher in the first phase of lockdown as compared to pre-lockdown levels, the report noted.
The Delhi University North Campus area recorded a decrease of 71 per cent and 61 per cent in PM2.5 levels during the first and second phases of lockdown.
Shadipur in west Delhi saw a reduction of 83 per cent in PM2.5 levels during the second phase of the lockdown. Mundka saw a 38 per cent reduction in the first phase of lockdown, while the ITO area saw a 32 per cent reduction during the first phase of lockdown.
The highest reduction in the first phase of lockdown, as compared with the levels of 2019, was recorded at IHBAS in the Dilshad Garden area of east Delhi at 89 per cent.
PM10 levels reduced by 60 per cent in hotspots like Dwarka, Mundka, Wazirpur and RK Puram during both the phases of lockdown as compared to 2019 levels.
The report attributed this to reduced road dust resuspension due to minimal vehicular movement and restriction of construction and demolition activities.
The contribution of vehicular emissions reduced to five per cent from 19 per cent during the pre-lockdown phase.
Black carbon, which is primarily contributed from biomass burning and traffic emissions, was observed to drop in total PM2.5 composition to 6-8 per cent during the lockdown phases, from 12 per cent during the pre-lockdown period. “Biomass burning factor was found to steadily rise from lockdown,” the report said.
Contribution from power plants increased during the lockdown Phase-I (25 per cent) and Phase-III (20 per cent), as compared to the pre-lockdown phase (10 per cent).
Gurugram saw a 61 per cent reduction in PM10 levels during the first phase of the lockdown, in comparison with 2019 levels. Ghaziabad saw a 54 per cent reduction in PM2.5 levels and Faridabad recorded a reduction of 70 per cent in its PM2.5 levels.
PM10 levels further reduced by over 60 per cent in Gurugram, Noida and Ghaziabad in the second phase of lockdown, as compared to 2019 levels, in all likelihood due to restriction on dust generating activities, the report said.
Pollutant levels
The restrictions on vehicular activity led to a 48 per cent and 52 per cent reduction of NO2 as compared to pre-lockdown levels.
Eighty-one per cent of Delhi’s NOx comes from the transport sector. Benzene, the main source of which is transport and other industrial sectors, also saw a decline of 50 per cent and 39 per cent during the first and the second phases of lockdown.
SO2 decline in Delhi was not as stark as that of NO2 since most of its SO2 originates from power plants around the city, according to the TERI Emission Inventory, 2018.
These were operational during the lockdown. SO2 levels decreased by six per cent in the phase-I of lockdown but remained similar to pre-lockdown levels during lockdown Phase-II.
Since summers had kicked in, it might be likely that electricity demand might also have increased, the report said. However, this needed further data to conclusively derive a reason, it added.
Significant reduction in NO2 levels was observed in Noida (57 per cent) and Ghaziabad (67 per cent) during the first phase of lockdown, when compared with 2019 levels.
“SO2 levels were seen to decrease in Noida (50 per cent) and Ghaziabad (46 per cent) in the first phase of lockdown, while on the other hand, Gurugram showed an increase in SO2 levels, which may be due to its proximity to thermal power plants,” the report said.
Noida and Ghaziabad recorded an enormous reduction of 67 per cent and 80 per cent respectively during the first phase of lockdown and 62 per cent and 47 per cent in the second phase of lockdown, as compared to levels during 2019 in the same periods.
Benzene levels were seen to increase in Faridabad and Gurugram during both phases of lockdown, as compared to pre-lockdown levels, the report said.
“The operation of certain units or processes (chemical / pharmaceutical / paints) utilising benzene and other solvents, etc in Faridabad and Gurugram cannot be ruled out and may be responsible for the increase in benzene levels,” it added.
Roychowdhury said the dramatic reduction in pollution levels reported across the country also indicated the scale and speed of change that was needed in all sectors and in all regions simultaneously to minimise the regional influence on air quality.
“We have to prepare for a similar scale and speed of change locally as well as regionally, as the economy reopens,” Roychowdhury said.
We are a voice to you; you have been a support to us. Together we build journalism that is independent, credible and fearless. You can further help us by making a donation. This will mean a lot for our ability to bring you news, perspectives and analysis from the ground so that we can make change together.

.png)
Comments are moderated and will be published only after the site moderator’s approval. Please use a genuine email ID and provide your name. Selected comments may also be used in the ‘Letters’ section of the Down To Earth print edition.