

Agriculture is responsible for one-third of non-CO2 greenhouse gas (GHG) emissions in the world. Changing agricultural practices and shifting to a diet that's devoid of meat and dairy products could reduce the sector's emissions by up to 50 per cent by 2050, find researchers.
Agriculture’s carbon footprint
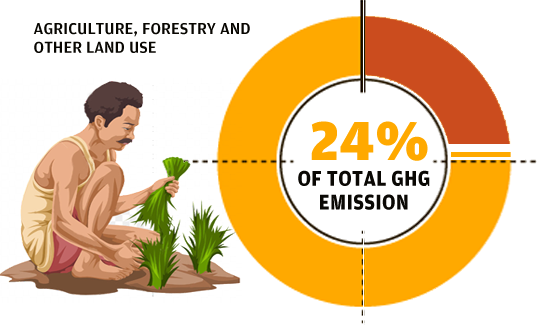
Farms emitted 6 billion tonnes of GHGs in 2011, or about 24 per cent of total global emissions. That makes the agricultural sector the world’s second-largest GHG emitter after the energy sector (which includes emissions from power generation and transport).

Did you know? The livestock sector contributes an estimated 7,100 million tonnes of CO2 equivalent per year, representing 14.5 per cent of human-induced greenhouse gas emissions
Graph shows the global GHG emission by sector
Hover over the graph to see details
Which countries produce the most agricultural emissions?
The 10 countries with the largest agricultural emissions in 2011 were (in descending order): China, Brazil, United States, India, Indonesia, Russian Federation, Democratic Republic of Congo, Argentina, Myanmar, and Pakistan. Together, these countries contributed 51 per cent of global agricultural emissions.
Did you know?
39 per cent of emissions from agriculture come from only 4 countries: China, India, Brazil, and the USA
In 2011, 44 percent of agriculture-related GHG outputs occurred in Asia, followed by the Americas (25 per cent), Africa (15 per cent), Europe (12 per cent), and Oceania (4 per cent), according to FAO's data. This regional distribution was fairly constant over the last decade. In 1990, however, Asia's contribution to the global total (38 per cent) was smaller than at present, while Europe's was much larger (21 per cent).
Changing face of global agricultural emissions
In 2016, the amount of atmospheric methane reached a new high of about 1,853 parts per billion (ppb)—about 60 per cent comes from human activities like cattle breeding, rice agriculture and landfills. The burden of nitrous oxide was 328.9 parts per billion in 2016—22 per cent higher than in the pre-industrial era, mainly as a result of biomass burning and fertiliser use. From 1990 to 2010, global agricultural emissions increased 8 per cent. They are projected to increase 15 per cent above 2010 levels by 2030, when they will amount to nearly 7 billion tonnes per year.
Did you know? From 2012 to 2030, N2O emissions from agricultural soils are projected to increase by 3.8 per cent, from 2,114 million tonnes of CO2 equivalent to 2,195 million tonnes, which corresponds to 38.1 per cent of total agricultural emissions
From 1990 to 2012, total emissions from other agricultural sources (such as burning of crop residues) increased from 277 million tonnes of CO2 equivalent to 301 million tonnes, corresponding to approximately 5.6 per cent of total agricultural emissions in 2010. These increases are mainly driven by population growth and changes in dietary preferences in developing economies. Agricultural emissions growth will be greatest in Asia and sub-Saharan Africa, which will account for two-thirds of the increase in overall food demand over first half of the 21st century. The production of vegetable oils and animal products – products with a high GHG intensity—are expected to grow the most amongst agricultural outputs.
Agricultural emissions from crop and livestock production grew from 4.7 billion tonnes of carbon dioxide equivalents in 2001 to over 5.3 billion tonnes in 2011, a 14 percent increase. Meanwhile, net GHG emissions due to land use change and deforestation registered a nearly 10 percent decrease over the 2001-2010 period, averaging some 3 billion tonnes CO2 eq/yr over the decade.
How is agriculture related to land use change?
 Agriculture is responsible for 75 per cent of global deforestation. Land use change and forestry (LUCF) caused 4 per cent of global emissions in 2010 and 14 per cent of the aggregate, global emissions from 1990 to 2011. Most of these LUCF emissions are intimately connected to agriculture, as many resulted from deforestation caused by expansion of farms into tropical forests. In contrast, forest stocks are increasing in many non-tropical regions (e.g., North America and China), due largely to forest regrowth on former farmland.
Did you know?
Past trends imply that about 10 million square kilometres of land will be cleared by 2050 to meet food demand, leading to annual emissions of 3,000 million tonnes of CO2 equivalent. Reducing land clearing to about 2 million square kilometres would reduce greenhouse gas emissions to 1,000 million tonnes of CO2 equivalent per year
The biggest opportunities to reduce agricultural emissions are
 According to estimations of the Food and Agriculture Organization of the United Nations the global demand for food is expected to increase by 3rd. 70 per cent until 2050. To ensure future food security, while reducing the impact on greenhouse gas emissions, more sustainable and resilient agriculture production is needed. Researchers from the International Institute for Applied Systems Analysis found that changes in agricultural practices and a shift away from meat and dairy could reduce 15 per cent of all agricultural methane and nitrous oxide emissions by 2050, a total of 0.8-1.4 gigatonnes of carbon dioxide equivalent per year (GtCO2e/y), at an already low cost of US$20/t CO2e. Dietary changes in overconsuming countries could contribute additional reductions of 0.6 Gt CO2e/y, a total emissions reduction of 23%.
Did you know? Each year, 30 per cent of global food production—almost 1.3 billion tonnes - is lost after harvest or wasted in retail and households. The direct economic cost of food wastage is $750 billion in terms of producer prices. Environmental costs add another $700 billion. The carbon footprint of wasted food is 3.3 GtCO2e (without emissions from land use change). The global blue water footprint of food wastage is about 250 km³. Produced but uneaten food vainly occupies almost 1.4 billion hectares of land.
Changes in both farming practices and food demand offer big opportunities. On the supply side, crop management practices—such as improved fertilizer management and conservation tillage—offer the greatest reduction potential at relatively low costs. Organic agriculture also provides environmental benefits through the sequestration of atmospheric carbon in soil organic matter. Soil organic carbon stocks were 3.5 metric tonnes per hectare higher in organic than in non-organic farming systems. Organic farming systems sequestered up to 450 kg more atmospheric carbon per hectare and year through CO2 bound into soil organic matter.
Sources:
✸ Agriculture's contribution to national emissions, CGIAR, November 2015
✸ Food and Agriculture Organization of the United Nations, FAOSTAT database, FAO, 2015
✸ Estimating Greenhouse Gas Emissions In Agriculture: A Manual to Address Data Requirements for Developing Countries, FAO, 2015
✸ Enhanced top soil carbon stocks under organic farming. A. Gattinger et al. In: PNAS, 2012
✸ The Emissions Gap Report 2017. A UN Environment Synthesis Report, 2017
✸ WMO Greenhouse Gas Bulletin. World Meteorological Organisation, October 2017
✸ Food wastage footprint: Impacts on natural resources. FAO, 2013
✸ Tackling Climate Change through Livestock: A global assessment of emissions and mitigation opportunities. FAO, 2013
✸ World Resources Report: Creating a Sustainable Food Future
✸ Image courtesy: Food and Agriculture Organization (FAO) and CGIAR