
Dry spread

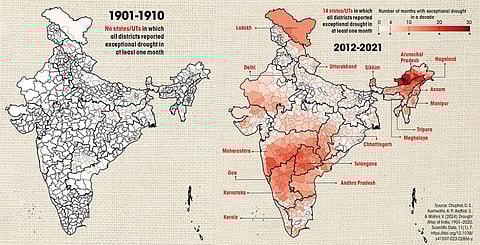
While the India Meteorological Department monitors drought using the Standardised Precipitation Index, this analysis utilises the Standardised Precipitation Evapotranspiration Index (SPEI) to evaluate drought intensity. SPEI, which looks at all processes by which water moves from the land surface to the atmosphere, is particularly well-suited for studying the impact of global warming on the severity of drought conditions.
A positive SPEI value indicates wetter conditions, whereas a negative value below -0.5 signifies drought, and a value below -2 represents exceptional drought, the most severe form of drought. In this analysis, SPEI data for each month is used to show frequency of short-term exceptional drought.

This was first published in the 1-15 February print edition of Down To Earth