
Subscribe

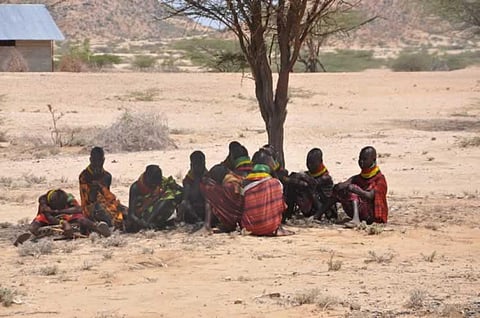
The Turkana County in Kenya experienced the highest increase in inequality in 2015-16 since 1994, according to a new report.
The Inequality Trends and Diagnostic in Kenya 2020 is a joint publication produced by the Kenya National Bureau of Statistics (KNBS) in partnership with the Africa Centre for Excellence for Inequality Research (ACEIR) based at the School of Economics, University of Nairobi.
Inequality is on the declining in Kenya in recent years but wide differences exist between rural and urban areas across the 47 counties in the country, according to the report.
The Gini coefficient, a measure of statistical dispersion that represents income or resource inequality within a nation, decreased to 0.363 in 2015-16 from 0.473 in 1994 for urban dwellers, and marginally to 0.347 in 2015-16 from 0.386 in 1994 for rural dwellers.
Among the counties, 35 out of 47 experienced a reduction in inequality between 1994 and 2015-16, while the remaining 12 counties experienced an increase in inequality over this period.
The county that experienced the highest increase in inequality in 2015-16 relative to 1994 was Turkana County, with a Gini coefficient of 0.559. Wajir County had the lowest Gini coefficient of 0.272.
The female unemployment rates were nearly double that of males in 1998-99 and in 2015-16. Youth unemployment rates were nearly double the overall rates, said the report.
Gender inequality remains one of the major obstacles to sustained human development in Kenya.
There was a gap between male and female enrolment and attendance in pre-primary, primary and secondary education levels. There was higher gender inequality in access to college and university education, with women being severely disadvantaged.
Of the 85 per cent learners who progress from primary to secondary school, 30 per cent proceed to higher education, according to the ministry of education records. Women account for just one third of total enrolments.
The report also found inequality in access to safe drinking water. In 2015-16, the proportion of poor households accessing safe drinking water was 63 per cent and that of the non-poor was 76 per cent.
In 1994 the proportion of the poor and non-poor households accessing safe drinking water was 42 per cent and 56 per cent, respectively.
The proportion of the non-poor accessing waste disposal services is higher than that of the poor over the study period, according to the report. For the poor, the proportion was 48 per cent in 2015-16, increased from 5 per cent in 1994.
For the non-poor, the proportion was 72 per cent in 2015-16, up from 15 per cent in 1994.
The report also highlighted electricity access inequality. Despite the increase in access, a higher proportion of non-poor households has greater access to electricity relative to poor households, and the gap widened over time.
Macdonald Obudho, director general, Kenya National Bureau of Statistics (KNBS) said:
The multidimensional approach to profiling inequality adopted in the report can facilitate the design of policy levers for addressing horizontal and vertical inequities that have been entrenched in Kenya for a long time.
The report called for deliberate government interventions to fight inequalities in all areas.
