
Subscribe

Water level in India’s 91 reservoirs is continuously on decline, especially in the last three months. The total live storage capacity has come down from 39 per cent in mid-February to 25 per cent as on April 12, according to the Central Water Commission.
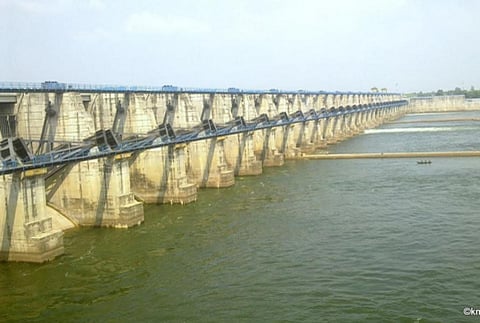
Total water available in live storage in 91 reservoirs in the country
12.04.2018: 40.857 BCM = 25 per cent of live storage capacity at FRL (full reservoir level)
15.03.2018: 51.389 BCM = 32 per cent of live storage capacity at FRL
15.02.2018: 63.597 BCM = 39 per cent of live storage capacity at FRL
Reservoirs in central India saw the biggest drop in water levels to 29 per cent from 43 per cent during the corresponding period in 2017. Similarly, north (from 23 to 20 per cent), east (from 49 to 42 per cent) and west (from 34 to 28 per cent) registered a significant decline.
Region wise comparison of current storage, corresponding storage of last year and average storage of last ten years (as per report of 12.04.2018)
|
Region |
Live storage available as percentage of total live storage capacity |
Corresponding storage of last year as percentage of total live storage |
Average storage of last ten years as percentage of total live storage |
|
Northern |
20 |
23 |
27 |
|
Eastern |
42 |
49 |
36 |
|
Western |
28 |
34 |
32 |
|
Central |
29 |
43 |
30 |
|
Southern |
16 |
12 |
22 |
As evident from the table above, only the southern region has seen an increase in live storage availability when compared to corresponding storage of last year. Ironically, the reservoirs in southern region have the lowest live storage (16 per cent) available.

State-wise live water storage
The table below shows that eight states have registered a constant decline in storage. The northern state of Himachal Pradesh saw a 35 per cent departure from normal storage between mid-February and mid-April. In the south, Telangana witnessed a 23 per cent departure from normal during these two months. Situation is equally grim Andhra Pradesh, which, currently, has 55 per cent less-than-normal water available in its reservoirs.
| Storage of the reservoirs in different states in the last few months | |||
|
Region |
States |
Date |
Departure from normal storage (Average of ten years) |
|
North |
H.P. |
15.02.2018 |
-1% |
|
|
|
15.03.2018 |
-18% |
|
|
|
12.04.2018 |
-36% |
|
|
Punjab |
15.02.2018 |
-36% |
|
|
|
15.03.2018 |
-38% |
|
|
|
12.04.2018 |
-46% |
|
West |
Gujarat |
15.02.2018 |
-33% |
|
|
|
15.03.2018 |
-37% |
|
|
|
12.04.2018 |
-36% |
|
Centre |
UP |
15.02.2018 |
-7% |
|
|
|
15.03.2018 |
-23% |
|
|
|
12.04.2018 |
-24% |
|
|
Uttarakhand |
15.02.2018 |
-21% |
|
|
|
15.03.2018 |
-36% |
|
|
|
12.04.2018 |
-35% |
|
South |
AP |
15.02.2018 |
-40% |
|
|
|
15.03.2018 |
-52% |
|
|
|
12.04.2018 |
-55% |
|
|
TG |
15.02.2018 |
0% |
|
|
|
15.03.2018 |
-3% |
|
|
|
12.04.2018 |
-23% |
|
|
TN |
15.02.2018 |
-63% |
|
|
|
15.03.2018 |
-63% |
|
|
|
12.04.2018 |
-64% |