
Subscribe

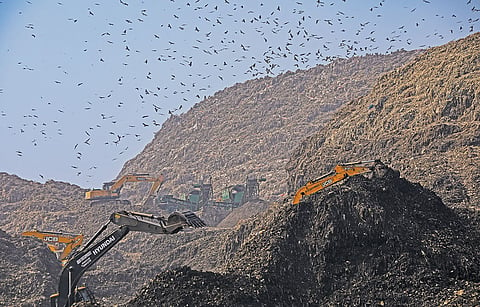
Dumpsites are a major urban challenge, contributing to air pollution, water contamination and various health hazards. Yet most cities in India continue to struggle with managing them. Delhi, for instance, is home to three major dumpsites—Ghazipur, Okhla, and Bhalswa—which have become environmental time bombs. These landfills release toxic gases into the air and contaminate groundwater through harmful leachates, exposing nearby communities to a wide range of health risks.
Despite the growing concerns, most cities still lack an accurate understanding of the size and waste burden of their dumpsites. Delhi alone generates about 11,000 tonnes of solid waste daily, a figure that excludes waste generated by the city’s floating population. The bulk of this waste ends up in these three overflowing dumps, making it difficult for authorities to manage or remediate it effectively. Efforts by municipal authorities, including bioremediation, biomining and waste-to-energy plants, are simply not enough to tackle the sheer volume of this waste.
Currently, most cities rely on manual estimation to understand the quantum of waste in the dumpsites. The process is lengthy, costly and in certain cases also not accurate, derailing the planning process. Instead, cities can use satellite imagery and Geographic Information System (GIS) technologies to efficiently quantify and monitor dumpsites. Satellite imagery makes the entire process of waste quantification quicker and cheap. Moreover, it provides a comprehensive view of changes in waste volume and surface conditions over time, making it easier to track the progression of these dumps.
Using satellite imagery, we tried to ascertain demarcation of the three dumpsites in Delhi, quantify their waste volume and study the change in their mean land surface temperature (LST) over time. LST, which tends to increase with higher waste levels, was utilised as a key indicator to track waste volume changes and validate our findings.
Our study spanned a decade (2013-24) and relied on satellite imagery from the US Geological Survey’s Landsat missions, specifically Landsat 5 and Landsat 9. These images were processed using QGIS to identify the dumpsites with coordinates (latitude and longitude) and superimpose them on composite satellite images to observe significant changes. LST was calculated using scientifically validated algorithms. To estimate dump volumes and areas, we employed a Digital Elevation Model from US space agency NASA’s Shuttle Radar Topographic Mission for 2013, and India’s IRS-Cartosat satellite data for 2024.
Results from our study reveals significant changes at the Bhalswa, Ghazipur, and Okhla dumpsites over the past decade. While the overall area of the dumpsites remained unchanged, the amount of waste they contain has more than doubled.
The Bhalswa dumpsite, covering 29.36 hectares (ha), saw an 88 per cent increase in waste, rising from 1.59 million tonnes (MT) in 2013 to 2.94 MT in 2024. Despite being the largest in size, Bhalswa’s waste burden is still outpaced by Ghazipur, which spans 28.72 ha. Ghazipur’s waste almost tripled in 10 years, reaching 3.34 MT in 2024—the highest among the three. The Okhla dumpsite, although smaller at 16.71 ha, experienced a 52 per cent rise in waste volume, going from 1.52 MT in 2013 to 2.31 MT in 2024.
In addition to the rising waste volumes, there has been a notable increase in mean LSTs at all three sites, a clear sign of escalating environmental pressure. Bhalswa recorded the sharpest temperature rise, from 31.39°C in 2013 to 35.89°C in 2024. Okhla’s mean LST jumped to 35.4°C in 2024 from 32.1°C, while Ghazipur saw an increase of nearly 2°C, reaching 34.11°C in 2024. The high temperatures indicate that much of the waste being dumped is organic, which generates significant heat as it decomposes.
We also generated 3D models of the dumpsites to visualise how their shapes have changed over time. Both Bhalswa and Ghazipur have transitioned from having multiple peaks in 2013 to a single peak in 2024, likely because of ongoing bioremediation efforts. Despite the reclamation initiatives, the waste burden continues to outpace efforts to reduce it, highlighting the need for more effective management strategies.
Our study highlights the immense potential of using GIS to monitor and manage urban dumpsites. Although we relied on freely available satellite images, which offer limited resolution, city administrators can access much more detailed and precise data by utilising high-resolution satellite images.
The study used open-source satellite images with a limited pixel range, which resulted in a variation of up to 5 per cent in the assessed waste quantities compared to figures reported by the Municipal Corporation of Delhi. However, this margin of error can be reduced to less than 1 per cent by using the latest high-resolution satellite data.
To validate our findings, we compared the data generated in our study with waste volume estimates from a concurrent drone survey at the Ghazipur dumpsite. The drone survey’s volumetric report showed a 97 per cent match with our GIS-based estimates.
By integrating GIS with remote sensing, GPS and diverse systems engineering models, city administrators can effectively measure and monitor waste dumps. These technologies not only provide accurate assessments of current waste volumes but can also help project future waste demands, aiding in long-term urban planning. This includes identifying appropriate locations for new sanitary landfill sites and improving overall waste management strategies.
(Surajit Chakraborty, Rohit Basudhar and Pradip K Sikdar are with the Indian Institute of Social Welfare and Business Management, Kolkata. Atun Roy Choudhury is with Cube Bio Energy, a waste management company in Hyderabad)
This was first published in the 1-15 October, 2024 print edition of Down To Earth