

India’s 2024 leopard assessment estimates 13,874 animals, but the real key to managing conflict lies in where they live.
Highly adaptable, leopards thrive near farms and settlements, making national totals insufficient for predicting attacks.
Long-term compensation records and spatial analysis, as seen in Indore and regions like Junnar and Greater Gir, pinpoint local hotspots for targeted mitigation.
India is home to an estimated 13,874 (Range: 12,616 – 15,132) leopards, according to the latest national assessment released in 2024, with Madhya Pradesh having the largest estimated population at 3,907. The estimate is based on the 2022 assessment and covers about 70 per cent of the country’s leopard habitat. The number matters, but the location of these animals may matter even more for managing conflict. Leopards are among India’s most adaptable large carnivores and can survive in fragmented forests, agricultural landscapes and areas close to settlements. National population estimates alone cannot tell a forest officer where the next livestock kill is most likely to occur.
That information is often already sitting in government records. Every livestock kill reported under a compensation system produces a piece of information. Taken together over several years, these records can reveal patterns. Studies from Junnar, Greater Gir, the Gangetic plains, and the Eastern and Western Ghats have shown how spatial analysis can identify areas where livestock predation is concentrated.
The lesson is becoming clear. Human-leopard conflict may be a national concern, but it occurs in very specific locations. A seven-year record from Indore Forest Division in Madhya Pradesh illustrates this point.
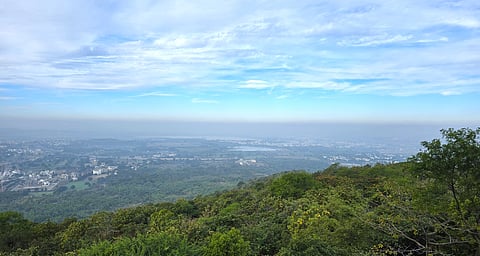
Indore Forest Division lies close to a rapidly expanding urban landscape. It covers approximately 604.74 km² of forest area and is divided into four ranges: Indore, Mhow, Manpur and Choral. The forest is not one continuous block. It includes fragmented forest compartments, agricultural land and revenue enclaves within the forest landscape. People and livestock use these areas every day. From 2019 to 2025, the division recorded leopard-attributed livestock kills. Field staff verified the incidents and recorded their locations. Of these records, 449 had usable GPS coordinates. These records formed the basis for the spatial analysis of the conflict pattern.
The first finding was straightforward but important: the incidents were not evenly distributed across the division. A kernel density analysis helps show where incidents are concentrated by looking at how closely they occur to one another. It identified three broad areas of higher incident concentration: a central belt, a southwestern cluster, and the northeastern part of the compartment chain around Choral Range. However, large parts of the division recorded relatively few incidents. This changes the way the problem can be viewed. Instead of treating the entire forest division as one conflict zone, the map points towards a much smaller set of locations where management attention can be concentrated (Figure 2).
The second finding was stronger. We used a Getis-Ord Gi* hotspot analysis, a statistical method that identifies areas where high numbers of incidents are clustered together rather than occurring randomly. It identified 172 statistically significant hotspot cells out of 1,352 analysed cells. These significant cells covered about 22 per cent of the analysed forest extent. In other words, the problem was not simply that some places had more incidents than others. Some areas had a clear and statistically significant concentration of incidents. This pattern also recurred over several years (Figure 3).
Several forest compartments in the principal clusters recorded incidents in five or more of the seven years. That recurrence matters for management. A single livestock kill may be difficult to interpret. A compartment that repeatedly appears in the records over several years is different. It suggests the location itself contributes to the repeated interaction.
The range-level figures tell a similar story. Mhow recorded 147 of the 449 incidents, followed by Choral with 110, Manpur with 102 and Indore with 90. The annual figures, however, do not show a simple upward trend. Incidents fluctuated between years, with higher numbers in 2021 and 2024 and a lower point in 2020. This distinction is important. The evidence does not show that leopard conflict is steadily increasing every year in Indore (Figure 4). It shows something more useful for management: conflict repeatedly occurs in particular places even when the annual number of incidents changes.
The hotspot compartments are largely associated with forest-agriculture boundaries and revenue enclaves within the forest. These are places where two very different uses of the landscape meet. Livestock are taken into or kept close to forest areas. Leopards use the same landscape for movement and hunting. Interior revenue enclaves create another type of interface. They may be geographically inside the forest but function as small islands of human use and livestock activity within leopard habitat. The result is a predictable overlap. This is why a map can be more useful than a division-wide assumption that every forest compartment carries the same risk.
The Indore results should not be treated as evidence that all leopard conflict in India follows the same pattern. Different landscapes produce different forms of conflict. In Junnar, Maharashtra, for example, researchers analysed compensation records covering two decades and identified different categories of conflict hotspots. Livestock depredation increased substantially in the later part of the study period, and the spatial patterns provided a basis for targeted mitigation. In northern West Bengal, researchers found significant spatial clustering of leopard attacks on people in a landscape made up of forests, tea plantations, agricultural fields and settlements. Importantly, attacks were concentrated in particular tea estates rather than being evenly distributed across the landscape. Research from Karnataka has similarly shown that leopards occupy large areas outside designated protected areas and that their presence and conflict are associated with features such as vegetation, irrigated croplands and prey availability. Around Corbett, livestock depredation hotspots have also been mapped along particular parts of the landscape rather than being distributed uniformly.
These studies point towards a common principle: there is no single national geography of leopard conflict. The response therefore cannot be a single national template applied identically everywhere. But there can be a common national system for collecting and using information.
This is where the Indore experience offers a larger lesson. Forest divisions are expected to maintain records of livestock kills and compensation cases. But the information generated by the system does not always remain in one clean, digital and spatially usable database. In practice, records can be scattered. Some may remain at the range level, some at the division office, while others are embedded in compensation files and related paperwork. As a result, information exists, but it is difficult to analyse. That is a missed management opportunity.
The first step should therefore be surprisingly basic: maintain a proper kill register. Every verified incident should have a standard set of fields, including date, location, GPS coordinates, livestock species, circumstances of the kill, verification details and, where possible, photographs. The next step is to bring the information together at the division level.
Once several years of records are available, even relatively simple GIS analysis can identify recurring hotspots. The Indore analysis used standard spatial tools and freely available satellite data. The purpose was not to build a complicated predictive model. It was to answer a practical management question: where does the problem repeatedly occur? That question can then lead to a more practical response.
Once recurring hotspots are identified, mitigation can be targeted. Livestock enclosures are an obvious example. There is little justification for providing expensive protective infrastructure uniformly across an entire forest division if only a small proportion of compartments repeatedly account for livestock losses. Resources can instead be concentrated around the villages and revenue enclaves adjoining persistent hotspots.
Strategic fencing can help at specific livestock routes and high-risk areas. But it should not be used across wildlife movement areas. Poorly planned fencing can restrict animal movement and create new problems. The aim should be to protect people and livestock at identified conflict points without further fragmenting wildlife habitat.
Patrolling can also become more strategic. Forest staff already cover large areas. If the records show that particular compartments experience repeated incidents during particular seasons or times, patrol effort can be adjusted accordingly.
Community engagement should follow the same logic. Instead of running broad awareness campaigns across an entire division, staff can prioritise settlements and livestock owners around recurring hotspots. They can discuss night-time livestock protection, grazing practices, carcass reporting and safe behaviour around leopard movement.
Technology can provide another layer of support. In conflict areas near expanding urban settlements, thermal drones and other night-time monitoring tools could be deployed selectively to understand leopard movement and identify repeated approaches toward livestock holding areas (Figure 5).
Such surveillance should be used as a management tool, not as a substitute for habitat management or community engagement. The objective is not to chase every leopard. It is to understand where people, livestock and leopards repeatedly come together and reduce the chances of a harmful encounter.
India already has strong systems for wildlife monitoring and national assessments. But conflict management happens on the ground. National policy should therefore make local conflict records more useful. Forest divisions should maintain standardised digital livestock-kill registers, with GPS coordinates wherever possible. These records should be used to prepare conflict hotspot maps. Forest departments should also provide simple GIS tools to help field officers analyse the data. Mitigation funds should be based on risk, with priority given to recurring hotspots for livestock enclosures, patrolling and community engagement. Conflict records should also be linked with information on settlements, livestock, forests, roads and urban growth. Better coordination is also needed between forest departments, local administration, livestock departments and urban authorities where settlements are expanding into wildlife habitats.
The most important lesson from Indore may not be about leopards. It is about information. The 449 locations in this study came from routine field records, not from an expensive research programme. When these records were brought together and mapped, a clear pattern emerged. Conflict was concentrated in some areas, and several places recurred over the years.
The map cannot predict every future livestock kill. This is a descriptive analysis. Reporting practices, livestock husbandry, prey availability and landscape changes can affect the recorded pattern. But management does not always need a perfect prediction. It needs to know where the problem is.
If forest divisions maintain, digitise and map these records, they can become a useful management tool. The aim is not to remove leopards from human-use areas. It is to make coexistence safer and less costly. A proper kill register, a good map and timely action can help answer a simple question: where is conflict happening, and what can we do before the next incident?
Methodology note: The analysis used 449 verified, georeferenced leopard-attributed livestock-kill records from Indore Forest Division covering 2019–2025. We conducted kernel density estimation and Getis-Ord Gi* hotspot analysis using ArcGIS Pro. Because the geographic coordinates of livestock-kill incidents are sensitive, we slightly displaced the coordinates before mapping and spatial analysis to protect the exact locations. This precaution was taken while retaining the overall spatial pattern of the recorded incidents for analysis.
Views expressed are the author’s own and don’t necessarily reflect those of Down To Earth