Rivers and streams in 31 states and Union territories in India do not meet water quality criteria


The Central Pollution Control Board (CPCB) in 2018 identified 351 polluted river stretches in India. The assessment of water quality for identification of polluted river stretches found that 31 states and Union territories (UT) had rivers and streams that did not meet the water quality criteria. These states / UTs have to submit their action plans for the same.
Maharashtra has the highest number of polluted river stretches (53), followed by Assam (44), Madhya Pradesh (22), Kerala (21), Gujarat (20), Odisha (19), and West Bengal and Karnataka (17).
The stretches of rivers not meeting with the criteria are identified as polluted stretches and categorised into five priority classes. The polluted river stretches are prioritised in five categories based on biological oxygen demand concentration consistently
The local bodies and departments concerned of the states / UTs will be liable to pay compensation of Rs 5 lakh a month per drain if the order is not implemented on time; and Rs 5 lakh per STP for default in commencement of setting up of the STP.
Almost 60 per cent of polluted river stretches exist in eight states: Maharashtra, Assam, Madhya Pradesh, Kerala, Gujarat, Odisha, West Bengal and Karnataka. The National Green Tribunal (NGT) on December 6, 2019 directed that 100 per cent treatment of sewage needed to be ensured — at least to the extent of in-situ remediation — before March 31, 2020, along with work on setting up of sewage treatment plants (STP) and connecting all drains to the STPs.
About 72,368 million litres per day (MLD) of sewage was generated against which operational treatment capacity was only 26,869 MLD in 2021, according to the latest CPCB report National inventory of sewage treatment plant 2021. This is not even half of the total sewage generated in the country. A huge amount of sewage is left untreated / partially treated and discharged directly into rivers.
Maharashtra, Assam, Madhya Pradesh, Kerala, Gujarat, Odisha, West Bengal and Karnataka have sewage treatment capacity disproportionate to the sewage generated, which is also one of the major reasons for the high number of polluted stretches in these states
Maharashtra
Maharashtra has maximum number of polluted river stretches in the country. Untreated sewage discharge in rivers is one of the major reasons for polluted river stretches in the state.
Sewage generation in Maharashtra is disproportionate to the installed treatment capacity. Estimated sewage generation is 9,107 MLD and installed treatment capacity 6,890 MLD, which is 75 per cent of the total sewage generation.
Out of 6,890 MLD installed treatment capacity, 6,366 MLD is operational treatment capacity, which is 70 per cent of the total sewage generation. It shows there is a gap of 2,741 MLD (30 per cent) in treatment capacity.
It is also observed that despite 6,366 MLD of available (operational) sewage treatment capacity, its actual utilisation is only 4,242 MLD. And there is still a vacant sewage treatment capacity of 2,124 MLD.
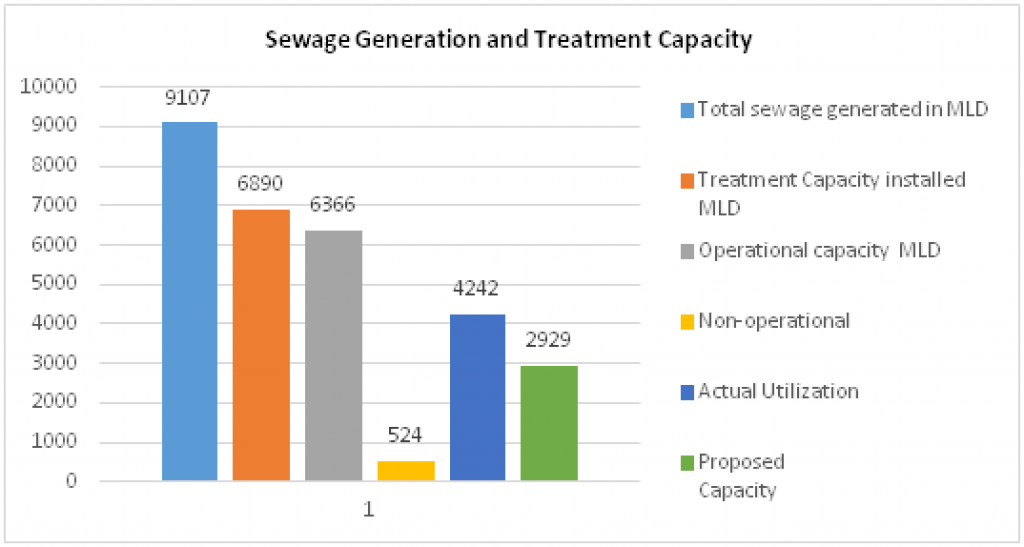
Sewage Generation and Treatment Capacity (MLD), Maharashtra
Assam
Assam has the second-largest number of polluted river stretches in the country. And there is no STP in Assam. Septic tanks are used for treatment of sewage. Estimated sewage generation in state is 809 MLD.
Madhya Pradesh
Madhya Pradesh has 22 polluted river stretches. And estimated sewage generation is 3,646 MLD, installed treatment capacity is 1,839 MLD, which is 50.44 per cent of total sewage generation of 3,646 MLD, and proposed capacity is 85 MLD.
The installed treatment capacity is 1,839 MLD; 684 MLD is the operational treatment capacity, which is only 18.7 per cent of total sewage generation. The actual utilisation, however, is 536 MLD. There is still a vacant sewage treatment capacity of 148 MLD.

Sewage Generation and Treatment Capacity (MLD), Madhya Pradesh
Kerala
Kerala has 21 polluted river stretches. And estimated sewage generation is 4,256 MLD and installed treatment capacity is 120 MLD, which is only 2.82 per cent of the total sewage generation (seven STPs).
The operational capacity is 114 MLD of 120 MLD installed capacity, which is 2.67 per cent of total sewage generation in the state. There is a gap of 4,142 MLD (97 per cent) in treatment capacity.
The actual utilisation is only 47 MLD. There is still a vacant sewage treatment capacity of 67 MLD.

Sewage Generation and Treatment Capacity (MLD), Kerala
Gujarat
Gujarat has 20 polluted river stretches. Estimated sewage generation is 5,013 MLD, installed is 3378 MLD, which is 67.38 per cent of the total sewage generation. The operation treatment capacity is 3,358 MLD, which is 67per cent of total sewage generation. It showed a gap of 1,655 (33 per cent) in treatment capacity.
It is also observed that despite 3,358 MLD of available (operational) sewage treatment capacity, its actual utilisation is 2,687 MLD. There is still a vacant sewage treatment capacity of 671 MLD.

Sewage Generation and Treatment Capacity (MLD), Gujarat
Odisha
Odisha has 19 polluted river stretches. Estimated sewage generation is 1,282 MLD and installed 378 MLD (14 STPs), which is only 29.48 per cent of the total sewage generation. Out of 378 MLD of installed treatment capacity, only 55 MLD is the operational treatment capacity, which is 4.3 per cent of the total sewage generation.
There is a gap of 1,227 MLD (95 per cent) in treatment capacity. It is also observed that despite 55 MLD of available (operational) sewage treatment capacity, its actual utilisation is 50 MLD.

Sewage Generation and Treatment Capacity (MLD), Odisha
West Bengal
West Bengal has 17 polluted river stretches. Estimated sewage generation for West Bengal is 5,457 MLD and installed treatment capacity is 897 MLD which is only 16.4 per cent of the total sewage generation and proposed treatment capacity is 305 MLD.
Out of 897 MLD of installed treatment capacity, 337 MLD is operational treatment capacity which is 6.18 per cent of the total sewage generation. There is a gap of 5,120 MLD (93.8 per cent) in treatment capacity.
Despite 337 MLD of available (operational) sewage treatment capacity, its actual utilisation is 213 MLD.

Sewage Generation and Treatment Capacity (MLD), West Bengal
Karnataka
Karnataka has 17 polluted river stretches. The estimated sewage generation is 4,458 MLD and installed treatment capacity is 2,712 MLD (140 STPs), which is 60.83 per cent of the total sewage generation.
Out of 2,712 of installed treatment capacity, operational capacity is 1,922 MLD, which is 43.3 per cent of total sewage generation and shows there is a gap of 2,536 MLD (56.9 per cent) of treatment capacity in the state.
Despite 1,922 MLD of available (operational) sewage treatment capacity, its actual utilisation is 1,786 MLD.

Sewage Generation and Treatment Capacity (MLD), Karnataka
Madhya Pradesh (81 per cent), Kerala (97 per cent), West Bengal (93.8 per cent) and Odisha (95 per cent) has more than 80 per cent of sewage treatment capacity gap with respect to sewage generation; Assam does not have any STP; Gujarat has 33 per cent and Maharashtra has 30 per cent sewage treatment capacity gap.
Nivit Kumar Yadav, director, industrial pollution team, Centre for Science and Environment:
“CPCB study reveals that discharge of untreated wastewater is one of the main causes of river pollution in states. There is either not sufficient treatment capacity or capacity is under-utilised in the states. This is one of the reasons why action plan to clean the polluted river stretch is not working. Action plan for a polluted river stretch is a good step in cleaning river, but regulators have lost focus. They now only concentrate on polluted stretch and river pollution is ignored.”
DD Basu, advisor, CSE, said minimum flow of river is important to discharge treated sewage. Treated sewage cannot make river, it needs minimum flow to make aquatic ecosystem. To maintain and restore the wholesomeness of river (Aquatic ecosystem) — mentioned in the preamble of Water Act, 1974 — is missing in river rejuvenation programme of India.
| State | Total number of identified polluted river stretches |
P1 | P2 | P3 | P4 | P5 |
| Maharashtra | 53 | 9 | 6 | 14 | 10 | 14 |
| Assam | 44 | 3 | 1 | 4 | 3 | 33 |
| Madhya Pradesh | 22 | 3 | 1 | 1 | 3 | 14 |
| Kerala | 21 | 1 | 5 | 15 | ||
| Gujarat | 20 | 5 | 1 | 2 | 6 | 6 |
| Odisha | 19 | 1 | 0 | 3 | 2 | 13 |
| Karnataka | 17 | 4 | 7 | 6 | ||
| West Bengal | 17 | 1 | 1 | 3 | 4 | 8 |
| Puducherry | 2 | 1 | 1 | |||
| Rajasthan | 2 | 1 | 1 | |||
| DD & DNH | 1 | 1 | ||||
| Delhi | 1 | 1 | ||||
| Total | 351 | 45 | 16 | 43 | 72 | 175 |
We are a voice to you; you have been a support to us. Together we build journalism that is independent, credible and fearless. You can further help us by making a donation. This will mean a lot for our ability to bring you news, perspectives and analysis from the ground so that we can make change together.

.png)
Comments are moderated and will be published only after the site moderator’s approval. Please use a genuine email ID and provide your name. Selected comments may also be used in the ‘Letters’ section of the Down To Earth print edition.