A Centre for Science and Environment analysis shows that the number of natural disasters reported in developing countries has increased

The number of extreme weather events is rising alarmingly across the world—increase in heat wave frequency and the number of warm days and nights across Europe, hurricanes in the US and Caribbeans, floods in Brazil and Uganda, flash floods in Nairobi, Kenya, rising sea level in tropical small island developing states, cyclone Pam in Vanuatu, droughts in West Africa, droughts and wildfires in the US, and droughts, floods and heat waves in India and Pakistan are just some examples.
Less discernible yet equally well recorded are the gradual impacts of climate change. Australia recorded its hottest summer ever and the warmest June and August were recorded in many parts of the world. Several events witnessed a departure from what would normally be expected. Globally, 2015 is on course to becoming the hottest ever recorded. The combined average temperature over global land and ocean surfaces for September 2015 was the highest for September in the 136-year period for which the record has been kept, at 0.90°C (1.62°F) above the 20th century average of 15.0°C (59.0°F), surpassing the previous record set in 2014 by 0.12°C (0.19°F). This increase has resulted in daily temperature extremes and heat waves across the world.
Climate extremes projections at global level
Some of the key projections of the Intergovernmental Panel on Climate Change (IPCC) report on climate extremes are as follows:
Global scenario: Trends of natural disasters
Trends in natural disasters frequency globally between 1970 to 2014
We have used EM-DAT, The International Disaster Database of Centre for Research on the Epidemiology of Disasters (CRED), for this analysis. EM-DAT maintains one of the most credible global databases on disaster reports. This contains essential core data on the occurrence and effects of over 18,000 mass disasters in the world from 1900 to present. The database is compiled from various sources, including UN agencies, non-governmental organisations, insurance companies, research institutes and press agencies.
Total number of globally reported natural disasters (flood, storm, drought and other types) between 1970 and 2014 are shown below.
Figure 1 clearly shows the following:

Natural disasters and people affected globally during 1900–2011
Analysis of global natural disasters has been done on the basis of reported number of deaths, financial loss and number of events by EM-DAT, as shown in Figure 2. This analysis shows that financial loss increased during this period. However, the number of reported deaths greatly decreased.

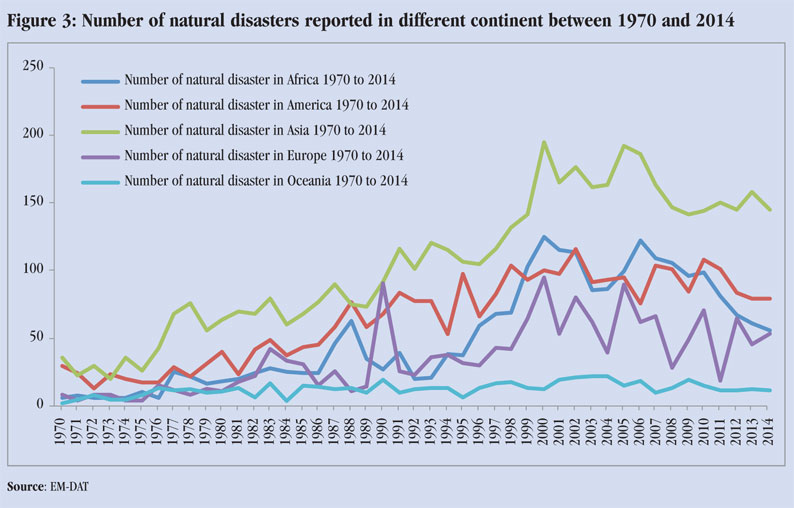
Trends in number of natural disasters continentwise between 1970 to 2014
Figure 3 shows the number of disasters reported between 1970 and 2014 in different continents of the world. It can be concluded that:
Africa scenario: Trends of natural disasters
The majority of disasters in Africa are hydrometeorological in nature, with droughts still affecting the largest number of people on the continent and floods occurring frequently along the major river systems and in many urban areas. Cyclones mainly affect Madagascar, Mozambique and some of the Indian Ocean islands. Table 1 lists some major disasters that took place in Africa between 2013 and 2015.

Frequency of disasters in Africa (1970-2014)
Figure 4 shows that the number of disasters reported in Africa has increased significantly, especially since 1970s. Between 1950 and 1964, disaster frequency remained below 10. It crossed 60 in 1988 and 120 in 2000 and 2006. Between 2006 and 2012, the number of disasters decreased a little but still remained above 60 a year.

Disaster trends in terms of total affected persons in Africa 1970-2014
There was an increase in the number of affected people in Africa between 1970 and 2014, as shown in Figure 5. There have been some peaks in 1980 and 1999, where the number of affected persons touched the figure of 34 million and 35 million respectively.

Indian scenario: Trends of natural disasters
India and the surrounding areas have witnessed many extreme weather events in the recent past. Floods in Gujarat spread into the Gir wildlife sanctuary killing at least 10 lions, 1,670 Nilgai and other wild animals in the region. caused massive destruction in 2014 and June 2015. Assam and other north-eastern states were ravaged by flood with more than 550 villages affected in Assam in June this year.
While destroyed crops in 15 states of the country, creating havoc for farmers, reportedly resulting in the death of approximately 1,153 farmers in Uttar Pradesh alone, 601 farmers in Maharashtra and various farmers in other states of country. Some farmers died due to shock due to crop loss; others committed suicides. This was followed by deadly heat waves which engulfed most of the northern states and caused a death toll of more than 2,100 in the southern states of Andhra Pradesh, Telangana, Odisha and West Bengal in April and June. EM-DAT database depicts India as one of the most disaster-prone countries of the world.
At present, India is facing a monsoon deficit of 14 per cent. A total of 302 districts across India, nearly half of its districts, received deficit or scanty rainfall this year, according to India Meteorological Department. As of October, 2015, various states of the country including Maharashtra, Madhya Pradesh, Karnataka, Odisha and Andhra Pradesh have been declared drought-hit by the state governments. Other states including Uttar Pradesh, Bihar, Gujarat, Telangana, Jharkhand, Rajasthan and Haryana might soon be declared drought-hit as they account for 149 of the 302 rainfall deficit districts of the country.
There is no reliable comprehensive disaggregated database on disasters in India. Many disaster events in India go unreported. Small-scale disasters (where casualties are less than 10) constitute an overwhelming majority of disaster events in India but are not captured by the international database maintained by EM-DAT. Despite these lacunae, India ranks third, after USA and China, in number of disasters events and fifth in terms of economic damages which shows the extreme vulnerability of the country to disasters.
Total persons affected by natural disasters in India between 1970-2014
Figure 6 gives a fair idea about the number of persons affected by various climate-related disasters occurring in India during 1970-2014. Maximum number of people were affected by drought (961 million). It can be seen from the graph that the number of people affected by flood during 1970-2014 went up to 814 million.

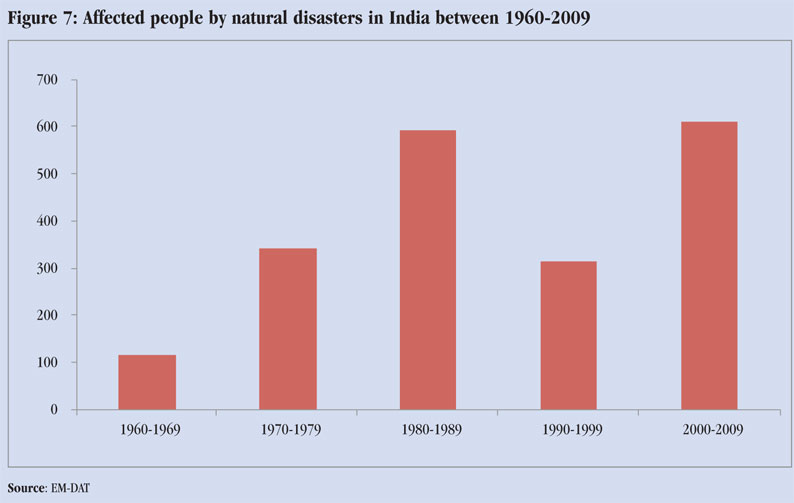
Decadal variation in affected people by natural disasters in India
Figure 7 shows the total number of affected people by natural disasters in India in different decades. Total number of affected people has increased substantially from 1960–69 to 2000–09.
A study by the National Institute of Disaster Management, India, (for the period 1974–2003) shows that India ranks ninth (7,413.5) in mean annual number of victims (people killed and affected) per hundred thousand inhabitants. The only countries which rank higher than India are Botswana (13,528.6), Djibouti (12,942.7), Bangladesh (12,388.5), Mauritania (11,853.5), Zimbabwe (8,192.1), Malawi (8,747.6), Antigua and Barbuda (8,248.6) and Mozambique (7,665.5), which are far below India in other indices of development.
Fund allocation for state disaster response fund/calamity relief fund in India between 1995 and 2015
Figure 8 clearly reflects how the fund allocation has been increasing considerably over the years in India. The decision to increase the size of state disaster response fund has been taken by the government of India, acknowledging that there has been “rising intensity and frequency of disasters” in India. The 10th Finance commission (1995–2000) had allocated Rs 63,042.7 million (value in 1995 terms) for SDRF, which subsequently increased to Rs 612,190.0 million (value in 2015 terms) in 14th Finance commission (2015–20) for this purpose.

We are a voice to you; you have been a support to us. Together we build journalism that is independent, credible and fearless. You can further help us by making a donation. This will mean a lot for our ability to bring you news, perspectives and analysis from the ground so that we can make change together.

 Flood displaced about 500,000 people in Manipur by August 3 (Credit: Santosh Phanjoubam)
.png)
Comments are moderated and will be published only after the site moderator’s approval. Please use a genuine email ID and provide your name. Selected comments may also be used in the ‘Letters’ section of the Down To Earth print edition.